Operations | Monitoring | ITSM | DevOps | Cloud

June 2019

Troubleshoot Faster with Anomaly Visualization

LogicMonitor is proud to announce anomaly visualization as an addition to our growing AIOps capabilities! With this new functionality, users are able to visualize anomalies that occur for a monitored resource and compare that anomaly to key historical signals, such as the past 24hrs, 7 days, or 30 days. Anomaly visualization complements LogicMonitor’s existing forecasting functionality and provides another layer of intelligence to better understand resource health.

Abstracting Credentials from Python Scripts

Python has rapidly grown into one of the most popular languages for automation. That’s why LogicMonitor supports Python when it comes to managing your LM portal and expanding your monitoring coverage with scripts. During your scripting adventures, you may find yourself wanting to take your work to the next level. One widely-applicable improvement is credential abstraction.

Viewing LogicMonitor Reports Within Dashboards

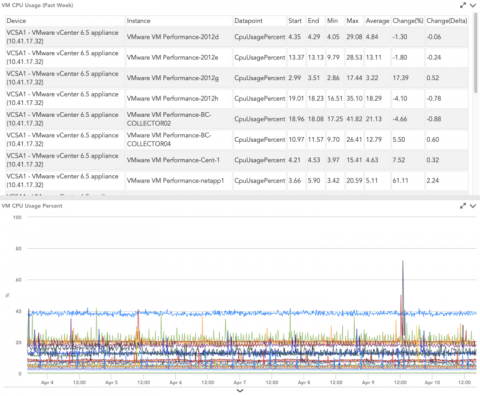
As a Sales Engineer, I hear interesting product requests on a daily basis, and integrating LogicMonitor reports with LogicMonitor dashboards comes up frequently. LogicMonitor's reporting engine has many useful functions from capacity planning to SLA calculation, and dashboards help users visually digest the raw data of reports.