Operations | Monitoring | ITSM | DevOps | Cloud

September 2024

How to spot and fix memory leaks in Go

A memory leak is a faulty condition where a program fails to free up memory it no longer needs. If left unaddressed, memory leaks result in ever-increasing memory usage, which in turn can lead to degraded performance, system instability, and application crashes. Most modern programming languages include a built-in mechanism to protect against this problem, with garbage collection being the most common. Go has a garbage collector (GC) that does a very good job of managing memory.

How we used Datadog to save $17.5 million annually

Like most organizations, we are always trying to be as efficient as possible in our usage of our cloud resources. To help accomplish this, we encourage individual engineering teams at Datadog to look for opportunities to optimize. They can share their performance wins, big or small, in an internal Slack channel along with visualizations and, often, calculations of the resulting annual cost savings.

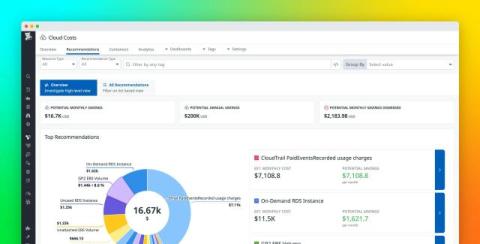
Optimize your AWS costs with Cloud Cost Recommendations

Managing your AWS costs is both crucial and complex, and as your AWS environment grows, it becomes harder to know where you can optimize and how to execute the necessary changes. Datadog Cloud Cost Management provides invaluable visibility into your cloud spend that enables you to explore costs and investigate trends that impact your cloud bill.

Operator vs. Helm: Finding the best fit for your Kubernetes applications

Kubernetes operators and Helm charts are both tools used for deploying and managing applications within Kubernetes clusters, but they have different strengths, and it can be difficult to determine which one to use for your application. Helm simplifies the deployment and management of Kubernetes resources using templates and version-controlled packages. It excels in scenarios where repeatable deployments and easy upgrades or rollbacks are needed.

Integration roundup: Understanding email performance with Datadog

Visibility into email health and performance is indispensable to any organization seeking to reach its customers through their inboxes. As they work to curtail spam, internet service providers (ISPs) are redefining the standards of deliverability on an ongoing basis, and organizations often struggle to adapt.

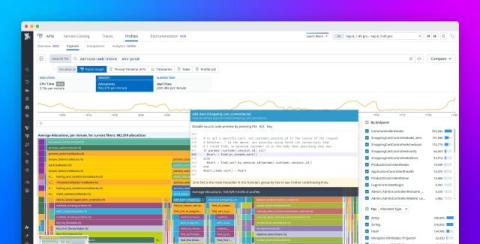
Optimize Ruby garbage collection activity with Datadog's allocations profiler

One Ruby feature that embodies the principle of “optimizing for programmer happiness” is how the language uses garbage collection (GC) to automatically manage application memory. But as Ruby apps grow, GC itself can become a big consumer of system resources, and this can lead to high CPU usage and performance issues such as increased latency or reduced throughput.

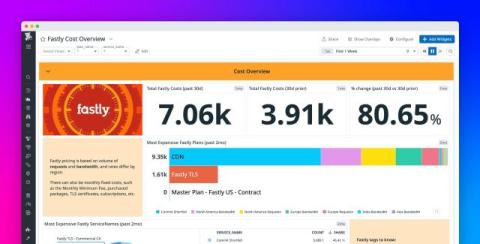
Get insights into service-level Fastly costs with Datadog Cloud Cost Management

As your organization scales its applications across many different cloud and SaaS providers, it becomes more challenging to understand your costs. You likely receive your bill at the end of the month, meaning you don’t have real-time visibility into who’s spending what and which services or applications your teams are spending the most on. Changing service costs also makes it difficult to break down your costs and identify what is driving spend, leaving you unable to take action.

Best practices for monitoring and remediating connection churn

Elevated connection churn can be a sign of an unhealthy distributed system. Connection churn refers to the rate of TCP client connections and disconnections in a system. Opening a connection incurs a CPU cost on both the client and server side. Keeping those connections alive also has a memory cost. Both the memory and CPU overhead can starve your client and server processes of resources for more important work.

Anthropic Partners with Datadog to Bring Trusted AI to All

At Datadog’s 2024 DASH conference, Anthropic President and Co-Founder, Daniela Amodei, announced the new Anthropic integration with Datadog’s LLM Observability. This new native integration offers joint customers robust monitoring capabilities and suite of evaluations that assess the quality and safety of LLM applications. Get real time insights into performance and usage, with full visibility into the end to end LLM trace. Enabling you to troubleshoot any issues, reduce downtime and get your Claude powered applications to market faster.

Key learnings from the State of Cloud Costs study

We recently released our initial State of Cloud Costs report, which identified factors shaping the costs of hundreds of organizations that use Datadog Cloud Cost Management to monitor their AWS spend. The report reveals several widely applicable themes, including the ways in which resource utilization, adoption of emerging technologies, and participation in commitment-based discount programs all shape cloud environments and costs.

Monitor Oracle Cloud Infrastructure with Datadog

Oracle Cloud Infrastructure (OCI) provides cloud infrastructure and platform services designed to support a broad spectrum of cloud strategies and workloads. OCI provides enterprise customers with scale-up resource scaling architectures, ultra-low-latency networks, and more to help them migrate legacy workloads to the cloud, while supporting cloud-native applications via an expansive network of cloud partners and services.

Monitor your Twilio resources with Datadog

Twilio is a customer engagement platform that helps organizations build communication features to meaningfully interact with customers on the channels they prefer. Twilio consists of a set of APIs for integrating communication tools such as voice, SMS, chat, video, and email into applications. Datadog’s Twilio integration collects a wide variety of logs to allow you to analyze performance issues and detect security threats across all of your Twilio resources.

Burn rate is a better error rate

While building our Service Level Objectives (SLO) product, our team at Datadog often needs to consider how error budget and burn rate work in practice. Although error budgets and burn rates are discussed in foundational sources such as Google’s Site Reliability Workbook, for many these terms remain ambiguous. Is an error budget a static quantity or a varying percentage? Does burn rate indicate how fast I’m spending a fixed quantity, or is it just another way to express error rate?