Operations | Monitoring | ITSM | DevOps | Cloud
May 2019
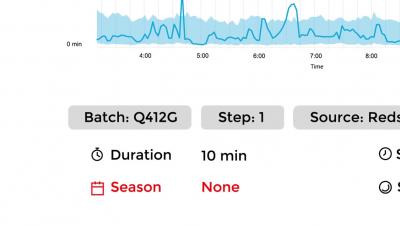
Anodot Demo: ITOps and Data Quality
Glitch List: May 2019
Many data-driven companies struggle with tracking anomalous behavior in their KPIs, let alone their more granular metrics, because traditional BI tools just can’t keep pace with big data. Manual processes, whether monitoring dashboards or setting static thresholds, often leads to missed incidents or prolongs time to resolution.
Low Latency vs. High Quality: Choosing Data Scheduling That's Right For You
Getting the right metrics at the right time could be the difference between running a smooth operation and making costly mistakes. And yet, data delays are still very much a part of data analysis today.
IDC Report: Less Than 5% of All Data Analyzed
The global data supply reached 4.4 zettabytes (ZB) in 2013 – or 4.4 trillion GB – but less than five percent of that data was actually analyzed, according to the seventh Digital Universe report by the IDC. Approximately 22 percent of all existing data would actually be useful if tagged and analyzed.
Your Business Analytics in 2020
Outlier Analysis: A Quick Guide to the Different Types of Outliers
Success in business hinges on making the right decisions at the right time. You can only make smart decisions, however, if you also have the insights you need at the right time. When the right time is right now, outlier detection can help you chart a better course for your company as storms approach – or as the currents of business shift in your favor. In either case, quick detection and analysis can enable you to adjust your course in time to generate more revenue or avoid losses.
5G is Rolling Out: Here's How Cognitive Analytics Will Take Part in the Revolution
5G is here and is widely expected to be a transformative communications technology for the next decade. This new data network will enable never-before-seen data transfer speeds and high-performance remote computing capabilities. Such vast, fast networks will need dedicated tools and practices to be managed, including AI and machine learning processes that will ensure efficient management of network resources and flexibility to meet user demands.
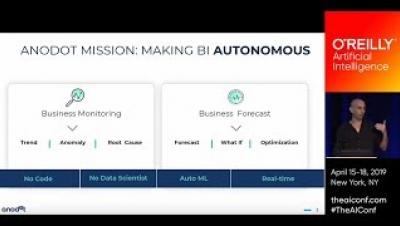
Deep Learning for Time Series Data (O'Reilly Artificial Intelligence Conference)
Predictive Maintenance: What's the Economic Value?
The global predictive maintenance market is expected to grow to $6.3 billion by 2022, according to a report by Market Research Future. However, a new paradigm is required for analyzing real-time IoT data. Predictive maintenance, which is the ability to use data-driven analytics to optimize capital equipment upkeep, is already used or will be used by 83 percent of manufacturing companies in the next two years.
Who Will Win and Who Will Die: 'Game of Throne' Fans Use Data Analysis to Predict What Happens Next
In the era of Peak TV, there is probably no more emblematic version of worthy binge watching than “Game of Thrones”. At the cusp of the series’ eighth and final season, the internet is buzzing with some painstaking analysis – using algorithms, AI, and big data sets, to find hidden Easter eggs. The numbers capture the mind-boggling detail author George R. R. Martin weaved into his novels and how easy it is to get lost in a fictional world as intricate as our own.
5 Critical Shortcomings of Traditional BI Tools
Business Intelligence (BI) tools have taken the business world by storm. According to new research, over 80% of executives believe that tools such as advanced visualization, dashboards, and reporting are critical tools when it comes to parsing data. However, many end users aren’t bringing in those dashboards because they really use them, rather they are hoping to get a sense of security (incorrectly) that they will know everything about their business.


