Operations | Monitoring | ITSM | DevOps | Cloud

Sensu

Understanding RBAC in Sensu Go

Regulating access to resources is a fundamental measure for enterprises to ensure the security and reliability of a system. The last thing you need is a stolen or weak password to give up the keys to the proverbial kingdom. With role-based access control (RBAC), this risk is mitigated by providing only the necessary access so a user in your organization doesn't have more access than needed.

Infrastructure as code: evolution and practice

As infrastructure has evolved and matured over the last decade, the way in which we build and deploy that infrastructure has — for the most part — kept pace. As the velocity of deployments increased, and practices such as continuous deployment and delivery became the norm, it became critical that we manage infrastructure and deploy applications in a similar way.

How to monitor 1,000 network devices using Sensu Go and Ansible (in under 10 minutes)

Network monitoring at scale is an age-old problem in IT. In this post, I’ll discuss a brief history of network monitoring tools — including the pain points of legacy technology when it came to monitoring thousands of devices — and share my modern-day solution using Sensu Go and Ansible.

Filters: valves for the Sensu monitoring event pipeline

Filters, the mechanism for allowing and denying events to be handled, have been given a refresh in Sensu Go. These new and improved JavaScript filters give you a way to express business logic through filtering, giving you more awareness of your environment, reducing alert fatigue, and improving performance. In this post, I’ll share what’s new with filters, using examples in Sensu Go. (If you haven’t already, you can download it here.)

Community roundup: making the switch from Nagios to Sensu

Wherever you’re at in your monitoring journey, you’ve probably used Nagios at one time or another. Love it or hate it, a legacy tool like Nagios played a critical role in establishing monitoring as a practice and helped train a generation of operators who required visibility into system dependencies and performance.

The next chapter: announcing the EOL schedule for Sensu Core 1.x and Sensu Enterprise 3.x

In case you missed it, Sensu Go became generally available in December 2018, and commercial support for Sensu Go became generally available just last month. With these major milestones now in our rearview mirror, it's time to help our customers reach their own milestones of migrating from Sensu to Sensu Go.

Making sense of time-series analysis

Even if you haven't heard of data described as a "time-series," you've probably seen examples out in the wild. As the name suggests, a time-series is a representation of an event over a period of time. That could mean representing many different changes: your application usage data, such as error rates over time or the growing number of activations per day.

How to measure every API call in your Go app (in fewer than 30 lines of code)

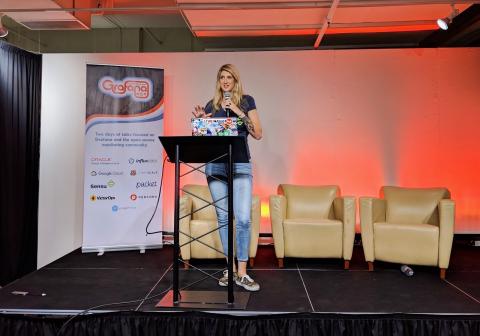
I recently gave a talk at GrafanaCon LA, which was heavily inspired by my blog post on check output metric extraction. During the talk, I dove into a popular monitoring use case with Sensu, InfluxDB, and Grafana — let’s call it the SIG stack . While I got to share some awesome features in Sensu that ultimately allow users to collect, store, and visualize their metrics, the conference was about Grafana, and folks wanted to see dashboards!