Operations | Monitoring | ITSM | DevOps | Cloud

Sumo Logic

Democratizing Machine Data & Logs: How Infor saves millions by leveraging Sumo Logic's data-tiering

Infor developed a decentralized governance model for managing the vast Sumo landscape. A landscape with thousands of users, tens of thousands of Collectors, petabytes of log ingestion. By democratizing log management, we implemented a decentralized governance model for our Sumo account. Consequently,, we succeeded in doubling our log ingestion year-over-year, while reducing our log ingestion cost by more than 50%.

The role of APM and distributed tracing in observability

Application performance management (APM) and distributed tracing are practices that many teams have been using for years to help detect and mitigate performance issues within applications – while the first one was born in the era of big single-host monoliths, the latter is especially useful for distributed applications that use a microservices architecture, in which tracing is critical for pinpointing the source of performance issues.

Sumo Logic platform video

Sumo Logic SaaS analytics platform makes the world's applications reliable and secure 24x7x365. Learn how Sumo Logic ingests data at scale, helps find and troubleshoot issues fast, and secures user experiences. We integrate with hundreds of out-of-the-box apps, making it easy and seamless to get more from your data quickly. Whether your data resides in multiple clouds or on-premises, now you can monitor, troubleshoot and secure your apps from ONE platform powered by logs.

Test Observability with Sumo Logic

The software industry has seen many evolutions. There is a new disruption in the market every five years or so. Software testing cannot remain isolated from all the latest trends and technologies. Testing strategies need to keep up with agile development, faster deployments and increasing customer demand for reliability and user-friendly interfacing. They need to be able to grow just as quickly and just as reliably as the business logic.

Monitoring with Prometheus vs Grafana: understanding the difference

Observability has become one of the most important areas of your application and infrastructure landscape, and the market has an abundance of tools available that seem to do what you need. In reality, however, most products - especially leading open source tools - were created to solve a single problem extremely well, and have added additional supporting functionality to become a more robust solution; but the non-core functionality is rarely best of breed. Examples of these are Prometheus and Grafana.

Learn how to use the common OpenTelemetry demo application with Sumo Logic

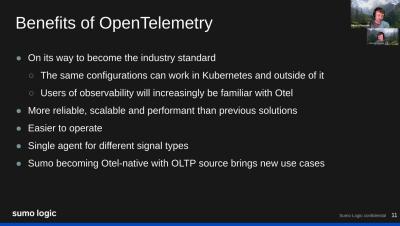
OpenTelemetry has gained significant adoption in the past year. This blog is about the common Otel demo application, but you can refer to this primer about OTel in general. Although it has gained recognition in the industry, there are still many people who haven’t started using OpenTelemetry. If you are interested in exploring its capabilities but you’re unsure where to start, keep reading.

Kubernetes vs Mesos vs Swarm

If you're reading this blog, you might ask yourself what container orchestration engines are, what problems they solve, and how the different engines distinguish themselves. Read on for a high-level overview of Kubernetes, Docker Swarm, and Apache Mesos, as well as a few of their notable similarities and differences.

Logging and monitoring Kubernetes

Kubernetes is first and foremost an orchestration engine that has well-defined interfaces that allow for a wide variety of plugins and integrations to make it the industry-leading platform in the battle to run the world's workloads. From machine learning to running the applications a restaurant needs, you can see that just about everything now uses Kubernetes infrastructure. All these workloads, and the Kubernetes operator itself, produce output that is most often in the form of logs.