Operations | Monitoring | ITSM | DevOps | Cloud

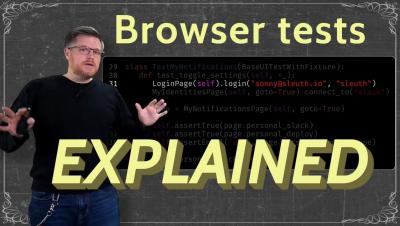
Automated browser tests EXPLAINED in code

Automated tests keep your code flowing, but don't stress about testing browsers. This video shows how browser tests are automated in real world through Selenium, Chrome, and Python code examples, with a bonus tip to help debugging in your Continuous Integration (CI) pipeline. The code and diagram graphics are generated via the Python library Code Video Generator, source in the links below.

CI/CD quick tip: Custom Slack message on code deployment

Notify Slack on deployment with a message customized for your team. This video walks you through how to create a Slack app, register a webhook, and use that webhook in your continuous delivery pipeline to send a custom message to Slack. If you don't want to do it yourself, try deployment notification in Sleuth. LINKS SLEUTH.

Track Datadog metrics in Sleuth

Data from monitoring tools like Datadog are useful for developers to help them understand whether the code they've deployed is healthy or needs to be fixed or rolled back, or when there is an incident to investigate. As a deployment mission control, Sleuth helps developers see metrics data from a developer-centric point of view - by deployment - and interpret such data for them. ‍‍

Expand your Sleuth monitoring reach with Datadog

One of our most commonly requested integrations, Datadog cloud monitoring, was announced last week on the Datadog blog! Sleuth organizes your deployments into projects, which collect and organize key data from your code sources and their associated staging environments. This data consists of metrics and errors.