Operations | Monitoring | ITSM | DevOps | Cloud

Latest Videos

KubeCon 2024 | Interviews with Observability Experts | Observability Insights with Aunsh Chaudhari

In this interview from KubeCon 2024, I sit down with Aunsh Chaudhari, a Product Manager at Splunk, to discuss the biggest trends shaping observability today. With a background in software development and hands-on experience with observability tools, Aunsh shares insights on OpenTelemetry adoption, cost optimization strategies, and the shift toward unified observability. We also touch on emerging topics like AI in observability and the challenges of scaling observability in modern environments.

Access your data with Federated Analytics for Amazon Security Lake. Insights from Splunk, AWS, and A

Federated Analytics gives organizations the full power of Splunk extended to data stored in Amazon Security Lake. Trusted partners like Accenture are helping bring these new capabilities to life at organizations around the world.

Kubernetes Monitoring and Alerting Made Easy with Splunk Observability Cloud and OpenTelemetry

In this video, I'll show you how to quickly setup monitoring and alerting for your Kubernetes clusters using Splunk Observability Cloud. We’ll start by deploying the Splunk OpenTelemetry Collector using Helm, and then use the Kubernetes Navigator inside Splunk Observability Cloud to view the health of our cluster and the applications it’s hosting. I’ll demonstrate AutoDetect detectors and alerts by intentionally triggering an issue in the cluster and walk through the alerting process. We’ll review the alerts in Splunk Observability Cloud and then resolve the issue in the cluster.

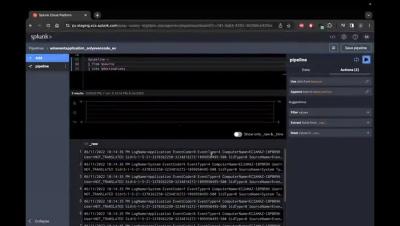
Create a Splunk pipeline to filter, mask, and route logs - without SPL2

In this video, we will take a look at how you can create a Splunk Data Management pipeline to filter, mask and route your logs with using any SPL2 code. For this demo we have used Ingest Processor to build our pipeline but the same concept can be used for Edge Processor as well.

KubeCon 2024 | Interviews with Observability Experts | Observability Insights with Josh Lee

Join me at KubeCon 2024 as I sit down with Josh Lee, Developer Advocate at Altinity, to discuss the latest trends, challenges, and insights in observability. In this interview, we cover key topics such as OpenTelemetry adoption (including the Open Agent Management Protocol), data sovereignty, standardization through semantic conventions, and the need to unify observability tooling across organizations.

How to Use Static Thresholds for Effective Alerts in Splunk Observability Cloud

In this video, we explore the concept of static thresholds, which are a foundational tool in your observability alerting solution. You’ll learn: Additionally, we will demonstrate static thresholds in Splunk Observability Cloud. We’ll configure a static threshold for AWS EC2 memory utilization. We’ll also look at additional threshold settings like trigger sensitivity and duration. By the end of this video, you'll have the knowledge to effectively incorporate static thresholds into your observability strategy.