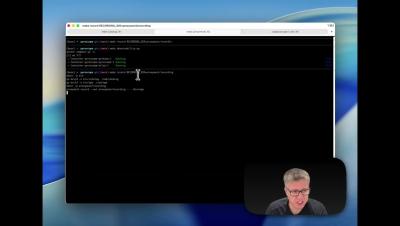
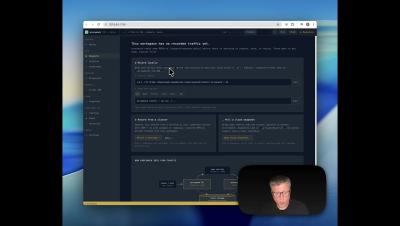
This video provides a step-by-step demonstration of how to record an application's real-world traffic and generate an automated sandbox environment for debugging and testing.
We spend thousands of dollars "token maxing" and running endless debugging cycles just to walk our LLMs through a problem. But is the AI actually failing, or are we just withholding the right environment? Giving your AI assistant its own sandbox to test hypotheses might just be the missing link in your development workflow.
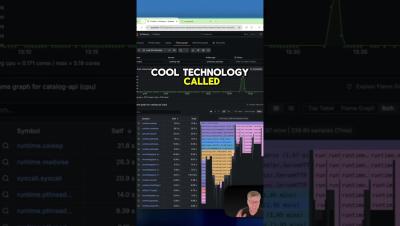
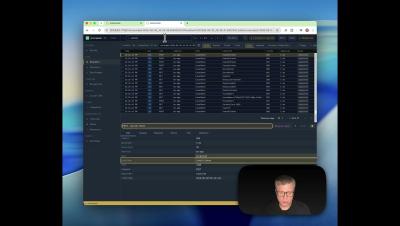
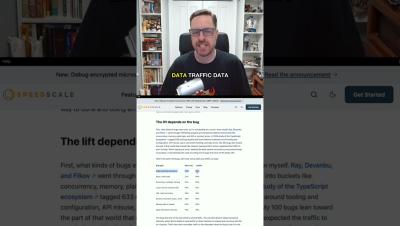
Tired of out-of-control log expenses and manual logging discipline? Discover next-generation observability with Speedscale. By using eBPF to record full-fidelity data right off the wire, you can instantly run full-text searches, track down leaking PII, and securely map out credentials across HTTP, Postgres, gRPC, and more—all without writing a single log line. Learn more: speedscale.com.
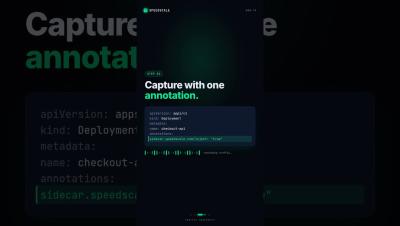
Learn how to get instant observability into your Kubernetes cluster by installing the Speedscale operator and proxymock tool. In this step-by-step tutorial, we walk you through setting up the operator to capture live network traffic (including encrypted traffic, API calls, and database calls) without complex instrumentation or manual configuration.