Operations | Monitoring | ITSM | DevOps | Cloud

Latest Posts

Replaying flows and troubleshooting issues in mobile app development using OpenTelemetry

iOS and Android apps are often a common component of distributed applications, forming a key part of the software architecture. These mobile apps provide another way to access data and perform actions on various services, requiring tight integration between the apps and the components which serve the data and control it.

Configuring Fargate custom application metrics in CloudWatch using Prometheus

Over the past few months, Helios has experienced rapid growth resulting in our user base increasing, our services multiplying, and our system ingesting more data. Like all tech companies that need to scale, we wanted to avoid our performance becoming sluggish over time.

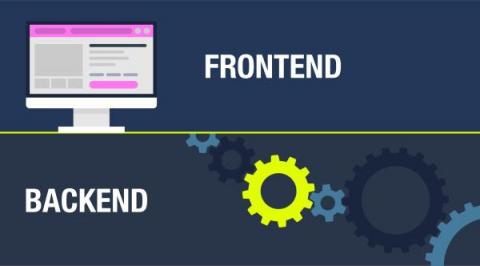
What Can OpenTelemetry Distributed Tracing Architecture Do for Frontend Developers?

When developers talk about the options OpenTelemetry opens up to them, one of the most powerful use cases is troubleshooting distributed architectures. With OTel data and insights, developers can identify bugs and solve a wide range of issues across various types of architecture and flows. These include asynchronous flows, flows with Lambda functions, and many more.

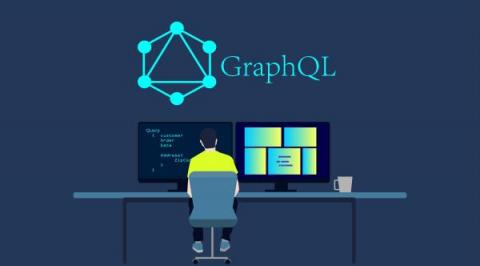
Visualizing GraphQL Traces in Microservices

One of the things that most excites me about what we at Helios are doing differently than anyone else is trace visualizations. While there are many ways to troubleshoot microservice architectures, a good visual overview goes a really long way to speeding up understanding and therefore accelerating time to a resolution. When your manager asks, “Why did that break down?” with Helios you can answer quickly with accurate data—this is the value of the Helios platform.

OpenTelemetry Java - Your Guide to Getting Started

OpenTelemetry (OTel), an open source project under the Cloud Native Computing Foundation (CNCF), is a collection of tools, APIs and SDKs for generating and collecting observability data (mainly trace, metrics and logs) from cloud-native applications. An industry-standard for distributed tracing and observability, OTel enables analyzing application health and performance to ensure production-readiness and support production monitoring.

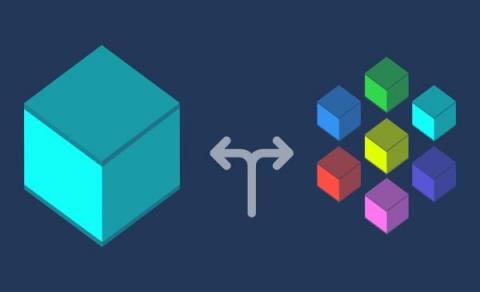
Microservices or a monolith - which one are you?

One analogy of a microservice architecture that I personally like is the idea of a large office setting with disparate departments communicating through an internal mail system. I imagine manilla envelopes being passed around, carried on carts through hallways, up elevators—passing the information one department needs to the next department.

5 Microservices Challenges and Blindspots for Developers

Microservices are loosely coupled services that are organized around business capabilities. In an ideal microservices architecture, each service can be developed and deployed independently. To form a functional application, these separate services communicate with each other in the production environment (and even beforehand).

New video: How to visualize your traces - tools and new ideas

In microservices, distributed tracing is a method for aggregating all the operations that occur in your distributed systems that were triggered by a specific request. If these traces are visualized, developers can gain insights into how their service behaves when it’s run with other services, which helps them understand why errors occur.

4 Ways to reproduce issues in microservices

Let’s say we have an issue in production. We’ve all been there, right? The first thing we want to be able to do is reproduce the issue. By reproducing, we can confirm it’s a recurring issue, rather than a sporadic one, and that it requires a fix to ensure that our product is working properly. When shifting from a monolith to microservices, reproducing issues becomes more of a challenge.

Why APM distributed tracing is not enough for developers

Distributed tracing is a method of tracking requests as they propagate through a distributed system. A trace is built from spans. Each span represents an interaction, like an HTTP request, a DB query, a serverless function invocation, etc. A trace is essentially a tree of spans. Based on the collected span data, a distributed tracing platform can capture all the interactions between the different architectural components and tie them together with a trace ID.