Operations | Monitoring | ITSM | DevOps | Cloud

Latest Posts

OpenTelemetry UI - See What's Possible With OpenTelemetry data

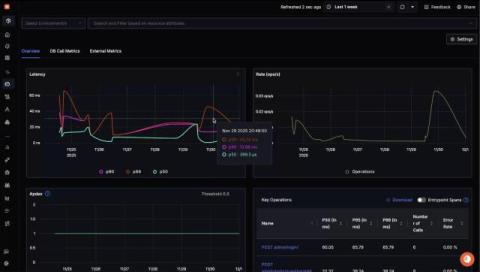
OpenTelemetry is a Cloud Native Computing Foundation(CNCF) project aimed at standardizing the way we instrument applications for generating telemetry data(logs, metrics, and traces). However, OpenTelemetry does not provide storage and visualization for the collected telemetry data. For visualizing OpenTelemetry data, you need an OpenTelemetry UI. The data collected by OpenTelemetry can be sent to a backend of your choice, which can then be visualized.

11 Top MongoDB Monitoring Tools - Including Free & Open-Source [2024]

MongoDB has become a cornerstone in modern database architectures. Its flexibility and scalability make it a go-to choice for many organizations. But with great power comes great responsibility—and the need for robust monitoring. There are many monitoring tools out there, and choosing the right one can be confusing. This article lists the top MongoDB monitoring tools, from open-source ones to fully managed SaaS solutions.

Single Pane of Glass Monitoring - Quick Guide & Open Source Solution

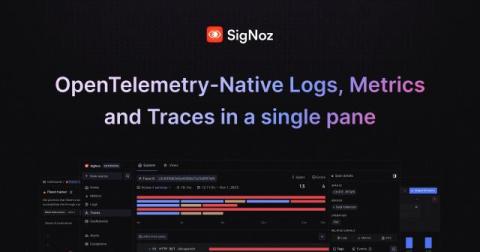
Single Pane of Glass (SPOG) monitoring is a term used to denote monitoring applications with a single tool that provides a comprehensive set of dashboards for the entire software system of an organization. Managing multiple monitoring tools for different aspects of the IT system becomes too cumbersome. And that’s how the concept of a single pane of glass monitoring evolved. Most modern applications are now built using distributed software systems.

Implementing OpenTelemetry with Nginx - Instrument and visualize traces

OpenTelemetry is an open-source standard for instrumenting cloud-native applications for generating different types of telemetry data. A robust observability framework set up using OpenTelemetry can help tremendously while troubleshooting software in production. Nginx is one of the most widely adopted web servers. Most often, nginx is used as a reverse proxy. It serves the frontend or backend applications behind the reverse proxy.

Health Check Monitoring With OpenTelemetry | Complete Code Tutorial

Health check monitoring is a critical practice for maintaining reliable and high-performing systems. It allows you to proactively identify and address issues before they impact your users. This guide explores the fundamentals of health check monitoring, its importance in modern systems, and practical strategies for implementation. You will also learn how HTTP endpoints can be monitored with OpenTelemetry.

Logs Search & Filter - Taking Quick Analysis of Logs to the Next Level

It is the last day of SigNoz Launch Week 2.0, and we’re excited to announce improvements in the logs module of SigNoz. Searching and filtering for logs to debug issues is one of the top critical workflows any developer uses. We have gathered feedback from our users and shipped some important features that focus on speeding up log searches, refining the filtering process, and enhancing the overall log analysis experience.

Introducing Alerts History and Scheduled Maintenance - Enhancing Alert Management in SigNoz

Today, we’re excited to introduce two key features that will help users with alerts in SigNoz - Alerts History and Scheduled Maintenance. These features are designed to help teams gain deeper insights into their alerts, better manage recurring issues, and streamline alert silencing during planned downtimes. Let’s dig in deeper.

Insights into SigNoz's Latest Features - A Conversation with Ankit, CTO of SigNoz

We sat down with Ankit, CTO and co-founder at SigNoz to get his insights on the product’s developments and what's on the horizon. He shared valuable perspectives on how SigNoz is enhancing the user experience, focusing on customer feedback, and building new features.

Introducing Correlation - Bringing Infra/APM Metrics and Logs Together in SigNoz

It is day 3 of SigNoz Launch Week 2.0, and we’re super excited to unveil features related to one of the core tenets of SigNoz. With SigNoz, you can monitor logs, metrics, and traces under a single pane of glass. With three signals under a single pane of glass, the scope for getting more context while debugging your application is immense. Using SigNoz, you can already correlate your traces with logs and check traces associated with APM metrics.