Operations | Monitoring | ITSM | DevOps | Cloud

The latest News and Information on Monitoring for Websites, Applications, APIs, Infrastructure, and other technologies.

Top 5 Hurdles for Intermediate Flux Users and Resources for Optimizing Flux

Now that you’ve read through Top 5 Hurdles for Flux Beginners and Resources for Learning to Use Flux, you’re well on your way to being an advanced Flux user. This post includes some of the top hurdles for intermediate Flux users as well as solutions.


Top 5 Hurdles for Flux Beginners and Resources for Learning to Use Flux

Are you new to InfluxDB v2.0 and Flux? Are you intimidated by learning a new time series scripting and query language? Perhaps you’re an InfluxDB v1.x user and you’re familiar with InfluxQL, and you’re unconvinced that learning Flux is worth your while? This two-part blog series aims to demonstrate the power of Flux and walk you through solutions to the top hurdles for both new and old InfluxDB users.

AWS Well-Architected Workload Recommendations in Splunk

The Well-Architected Tool is a new AWS service that compares the state of your workloads with AWS architectural best practices. Splunking your workload state and improvement recommendations will give you better insights into your applications as well as best practices to follow along your cloud journey. The Well-Architected integration in Grand Central will give you workload insights broken down by the following 5 pillars.

New Magic Dashboard for Ruby on Rails: ActionMailer

Monitoring your application can be a difficult task if you’re just getting started with it. You need to know which metrics matter most and understand which ones you can combine into meaningful graphs. In the (not just holiday ⛄️) spirit of making things smoother for our users, we’ve added a magic dashboard to the Ruby integration that shows you the volume of emails you are sending with ActionMailer.

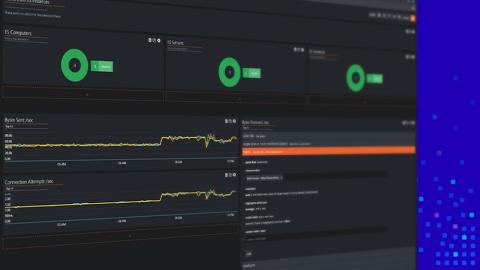
Improved Dashboard Designer experience with SquaredUp 5.0

At SquaredUp, we are all about dashboards and visualizations that enable you to build the ideal single pane of glass. If you work in monitoring, you know that designing the perfect dashboards that give you all of your important metrics at a glance, is easier said than done. Most of the time, it takes several attempts to optimize a dashboard for easy reading, and more often than not, this step is neglected. I wouldn’t recommend skipping over this step though.

Our new partnership with AWS gives Grafana users more options

At AWS re:Invent today, Dr. Werner Vogels, VP and CTO of Amazon.com, announced a partnership between AWS and Grafana Labs, resulting in the Amazon Managed Service for Grafana, a scalable managed offering that provides AWS customers a native way to run Grafana directly within AWS alongside all their other AWS services. We’d like to give a big thanks to the whole Grafana community. Not only have they inspired us with so many great use cases, but they help us build better software every day.

Why You Should Monitor Your Azure Infrastructure

Microsoft Azure and Microsoft, in general, has a history of being seen as designed for big enterprises only. Those days are in the past. Azure is working its way to the front of the pack for cloud services. It is easy to transition your workflows to Azure because it connects well with other Microsoft tools you use. Even though it is a smoother transition, it is just as complex and complicated as other large cloud providers.