Operations | Monitoring | ITSM | DevOps | Cloud

The latest News and Information on Monitoring for Websites, Applications, APIs, Infrastructure, and other technologies.

Server performance indicators in Uptrends

Website, web application, and API performance is everything. Many factors contribute to performance, such as network latency, use of performance-enhancing practices (use compression), minimizing server requests, and the strength of responding servers and their supporting infrastructure. If server performance is slipping due to load or age, you can find the signs in your reports.

Integrate Datadog Compliance Monitoring with your AWS Well-Architected workloads

Many of our customers rely on the Amazon Web Services (AWS) Well-Architected Framework as a guide to build safe, secure, and performant applications in the cloud. AWS offers the Well-Architected Review (WAR) Tool as a centralized way to track and trend adherence to Well-Architected best practices. It allows users to define workloads and answer a set of questions regarding operational excellence, security, reliability, performance efficiency, and cost optimization.

Introducing MinIO Support in Sematext

Sematext Logs is a Log Management-as-a-service. Think of it as your own central location for logs in the cloud. If you prefer or need to keep logs in your own environment instead of shipping it to the cloud Sematext Enterprise, designed to run on your own infrastructure, makes that possible. You can collect logs from any part of your software stack or infrastructure, IoT devices, network hardware, and much more.

How to monitor an Oracle database with Prometheus

In this article, we will explain how to monitor an Oracle Database with Prometheus using an exporter to generate metrics. Also, we will review the main metrics that you should monitor on resource usage and performance, and what to alert on to detect issues and incidents in your Oracle Database.

New Open Access with SquaredUp 5.0

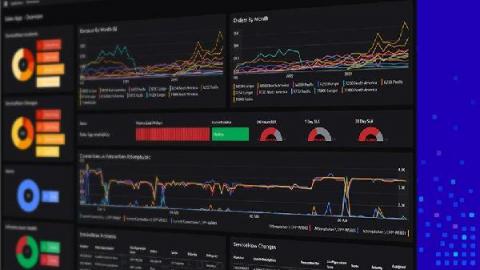
Our Open Access feature enables easy, and unlimited sharing of dashboards across your organization – with any audience at all. A highly popular feature, these shared dashboards help you bring better visibility and collaboration – conveying the shared “truth”! With our latest release SquaredUp 5.0, we have made Open Access dashboards fully interactive, like the rest of our dashboards, so you can see that next level of detail you’ve been wanting.

With the new AWS IoT SiteWise plugin, you can visualize and monitor your equipment data in Grafana dashboards

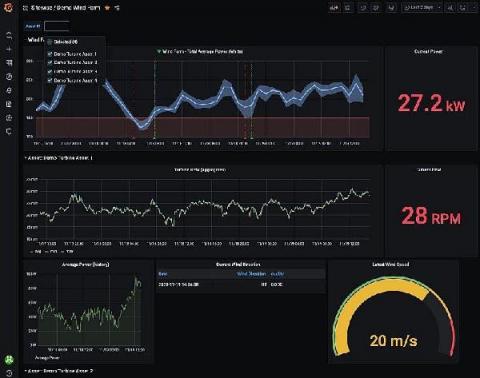
In collaboration with the AWS team, we have just launched another AWS integration, the AWS IoT SiteWise plugin for Grafana. AWS IoT SiteWise is a managed service that helps users collect, store, organize, and monitor data from industrial equipment, across facilities, at scale.

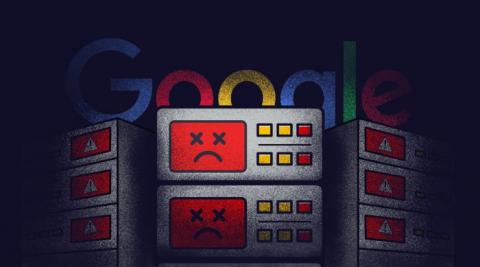
What the Google Outage Can Teach Us About Our Own Services

This week, the world stopped for a few hours as Google users experienced an outage on a massive scale. The outage affected ALL services which require Google account authentication. This includes the Google Cloud Platform (Cloud Console, Cloud Storage, BigQuery, etc.), Google Workspace (Gmail, Calendar, Docs, Drive, etc.) and Google Classroom. With the myriad of affected platforms, this particular outage was far from passing by unnoticed by users.

Webinar: Building Serverless Flows with AWS Step Functions

AWS Step Functions are an emerging solution in the field of serverless architectures, as they provide capabilities to coordinate between many services. This webinar takes the "Right to be forgotten" (GDPR) workflow as an example of a hands-on AWS Step Functions tutorial: use-cases, difficulties, and solutions. Combining Cloudway's experience with Lumigo's monitoring and debugging solution, we provide a full framework to manage multiple subsystems into a single serverless flow and get the work done.

Webinar: How to Monitor Serverless Applications

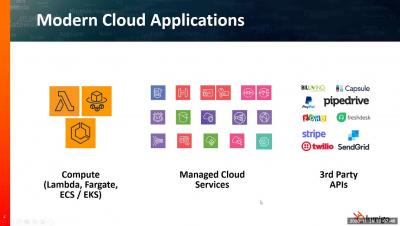
The software we write does not always work as smoothly as we'd like. To know if something went wrong, find the root cause, and fix the problem, we need to monitor our system and get alerts whenever issues pop up. There are many useful tools and practices for non-serverless applications. As we adopt serverless architecture can we continue to use the same approach? Unfortunately, the answer is no.