Operations | Monitoring | ITSM | DevOps | Cloud
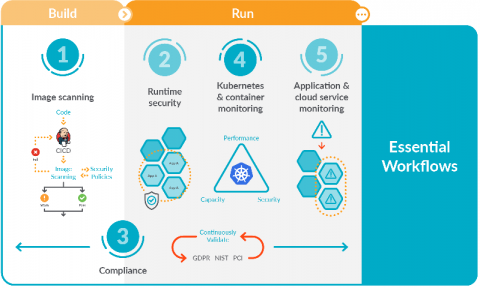
5 Essential workflows for secure DevOps
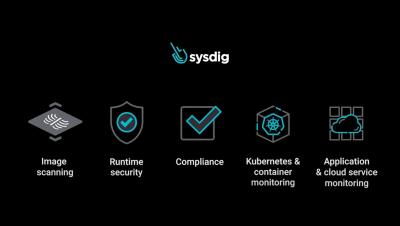
Focusing on these five essential workflows for secure DevOps will help you get started implementing monitoring, security, and compliance for containers and Kubernetes. You might be starting to adopt DevOps and find that it dramatically simplifies deploying applications in containers and Kubernetes. However, you probably also found that it adds a new set of complexities for managing, securing, and troubleshooting applications.
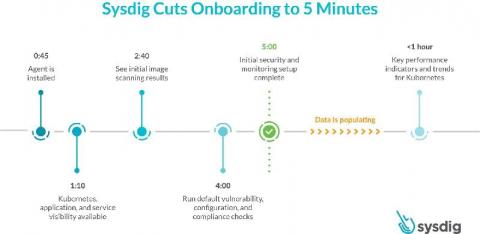
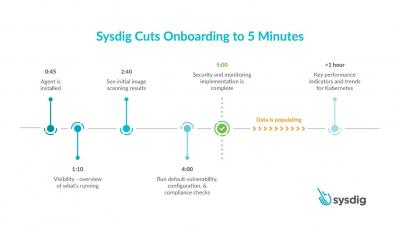
Sysdig cuts onboarding for container and Kubernetes visibility and security to 5 minutes
Today, we are excited to announce a faster onboarding for Kubernetes visibility and security. With the SaaS-first approach and new enhancements to the Sysdig Secure DevOps Platform, you can get results after just a five-minute setup. This release includes a new guided onboarding process, out-of-the-box dashboards as part of curated essential workflows, and a new Sysdig Essentials tier. 5 minutes to onboard secure DevOps - YouTube An error occurred.
Getting started with secure DevOps
5 minutes to onboard secure DevOps
Introduction to instrumenting applications with Prometheus
As a developer, getting metrics from your application onto a Prometheus graph can seem daunting. We’ll look at analyzing your service to find the most useful places to add metrics, how to add that instrumentation, getting it exposed and scraped, and then basic queries to use those metrics on graphs. Check out another article of mine for general reference on instrumenting, this one on Prometheus metrics, or this comparison on instrumentation alternatives.
12 Container image scanning best practices to adopt in production
Don’t miss out on these 12 image scanning best practices, whether you are starting to run containers and Kubernetes in production, or want to embed more security into your current DevOps workflow. One of the main challenges your teams face is how to manage security risk without slowing down application delivery. A way to address this early is by adopting a Secure DevOps workflow.
Detect CVE-2020-8557 using Falco
A new vulnerability, CVE-2020-8557, has been detected in kubelet. It can be exploited by writing into /etc/hosts to cause a denial of service. The source of the issue is that the /etc/hosts file mounted in a pod by kubelet is not included by the kubelet eviction manager, so it’s not taken into account when calculating ephemeral storage usage by a pod.
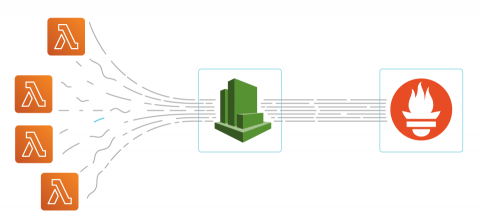
Monitoring AWS Lambda with Prometheus and Sysdig
In this post, we will show how it’s easily possible to monitor AWS Lambda with Sysdig Monitor. By leveraging existing Prometheus ingestion with Sysdig, you will be able to monitor serverless services with a single-pane-of-glass approach, giving you the confidence to run these services in production.
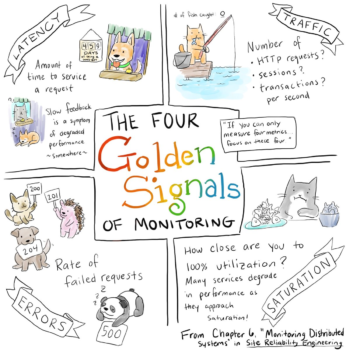
How to monitor Golden signals in Kubernetes
What are Golden signals metrics? How do you monitor golden signals in Kubernetes applications? Golden signals can help to detect issues of a microservices application. These signals are a reduced set of metrics that offer a wide view of a service from a user or consumer perspective, so you can detect potential problems that might be directly affecting the behaviour of the application.
Monitoring Kubernetes in Production
Monitoring Kubernetes, both the infrastructure platform and the running workloads, is on everyone’s checklist as we evolve beyond day zero and into production. Traditional monitoring tools and processes aren’t adequate, as they do not provide visibility into dynamic container environments. Given this, what tools can you use to monitor Kubernetes and your applications?
Best practices for alerting on Kubernetes
A step by step cookbook on best practices for alerting on Kubernetes platform and orchestration, including PromQL alerts examples. If you are new to Kubernetes and monitoring, we recommend that you first read Monitoring Kubernetes in production, in which we cover monitoring fundamentals and open-source tools. Interested in Kubernetes monitoring?


