Operations | Monitoring | ITSM | DevOps | Cloud

February 2021

The Future of InfluxDB OSS: More Open, Permissive with Complementary Closed Source

I was recently on the Changelog Podcast talking about Elastic’s recent change away from open source licensing. I’m at 1:02:45 to 1:24:03, but the whole thing is pretty interesting if you have time to listen. This is where #InfluxDB is headed. No more open core, we're going to a combination of cloud offering, or if on-premise, a complementary offering to the open source. It'll take us time to get there, but that's the vision. Commercial complements the open source rather than replace.

Monitoring DigitalOcean Billing with InfluxDB

I’ve always had a good experience using DigitalOcean, a cloud infrastructure provider which offers developers cloud services that help deploy and scale applications that run simultaneously on multiple computers. I’ve used DigitalOcean a lot for my personal projects — for example, to host my personal blog, its stats, and a NextCloud instance, all running in Kubernetes.

InfluxDB C Client Library for Capturing Statistics

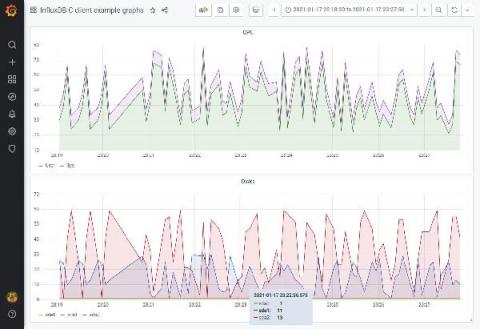
Currently, there is no official InfluxDB C language client library. Fortunately, I wanted to do exactly that for capturing Operating System performance statistics for AIX and Linux. This data capturing tool is called “njmon” and is open source on Sourceforge. So having worked out how and developing a small library of 12 functions for my use to make saving data simple, I thought I would share it. I hope it will prove useful for others.

A Partnership Between InfluxData and Ockam Brings Trust to Time Series Data

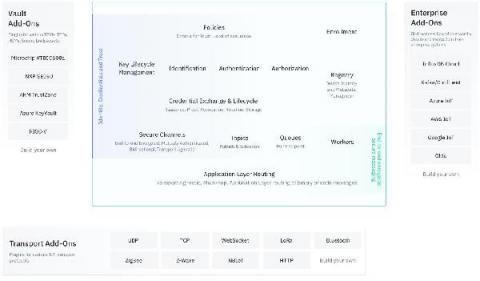
This article is a re-post of the article written by Matthew Gregory and published on the Ockam blog. Let’s investigate how to build applications with trusted time series data in a zero trust environment! To trust an application we need to trust the data that feeds into it. Increasingly, applications rely on time series data from outside the datacenter, at the edge, or in IoT. This means we need to think of trust and data in new ways.

Monitoring InfluxDB 2.0 in Production and at Scale

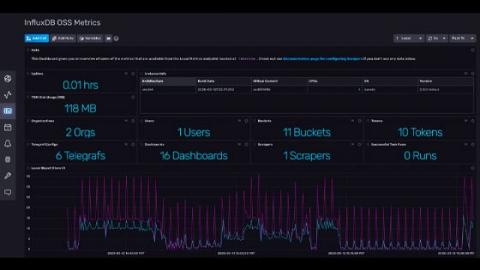
One of the great things about InfluxDB is that it is really easy to get up and running, and it doesn’t require much monitoring when you are dealing with datasets that fit well on your local dev machine. Once you start using InfluxDB in production and pushing orders of magnitude more data into the system, it’s critical to monitor how your instance is performing so that you can proactively respond to things like disk or network failures, memory saturation, and write or query loads.

InfluxDB Cloud is on Microsoft Azure Marketplace

Here at InfluxData, we’ve been focusing recently on deepening our support for Microsoft Azure. First we turned on InfluxDB Cloud on Azure West Europe, in Amsterdam, back in July. Then we launched InfluxDB Cloud on Azure East US, in Virginia, in September. Today, we’re pleased to announce that InfluxDB Cloud joins InfluxDB Enterprise on Azure Marketplace.

TL;DR InfluxDB Tech Tips - the Easiest Way to Use and Create InfluxDB Templates

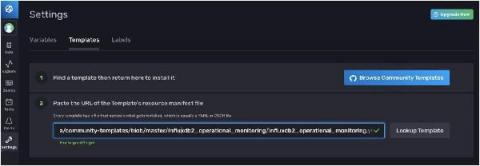
If you didn’t already know, one of the perks of InfluxDB 2.0 is having access to templates. InfluxDB templates allow you to easily apply a variety of preconfigured resources including Telegraf configurations, buckets, dashboard, tasks, and alerts to your InfluxDB instance. In this TL;DR we’ll walk through the easiest way to use and create a template.

How to Monitor Your Monitoring Solution with InfluxDB

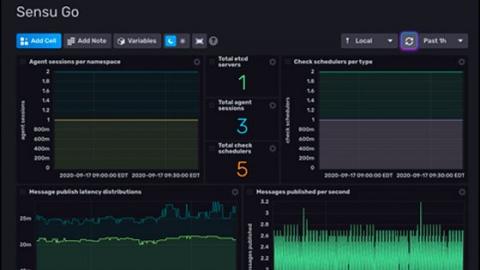
In the real world, if your observability pipeline goes down, you may not receive vital alerts for the system that’s being monitored. To solve that problem, I looked to Sensu Go internally, and decided to utilize the /metrics API endpoint that advertises Prometheus metrics. This is how I conceptualized the Sensu Go Monitoring Template, an InfluxDB Template, by simply posing the question: “How do you monitor your monitoring solution?”

Plotting the International Space Station's Orbit Live Using Telegraf, InfluxDB, and Giraffe

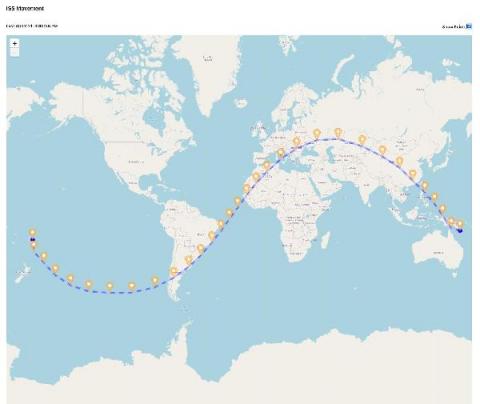
During an InfluxData internal hackathon, I was looking to work on a project that would help me strengthen my Telegraf and Flux skills. I also wanted to use InfluxData’s Giraffe to visualize my project in a React application. After reading Sean Brickley’s blog post on tracking the International Space Station with InfluxDB, I was inspired to build on this idea.

Building Strong Global Partnerships

Despite a halt in travel in 2020, InfluxData made incredible progress reaching users around the world through the new InfluxData Authorized Channel Partner program. The program features a robust ecosystem of distributor and reseller partners that help to support InfluxDB users around the world. In 2020, we welcomed 23 channel partners, including three regional distributors and 20 resellers in the Asia Pacific, EMEA and North American regions.

HAProxy Monitoring (the InfluxDB Way)

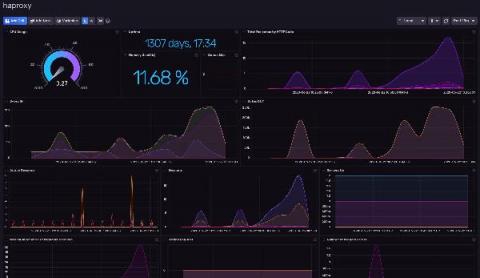
My personal experience with HAProxy dates back to my work with a previous company, where we used HAProxy to do load balancing between pairs of servers with specific roles. Those servers are the core of the major payment gateway in Uruguay, where thousands of users use them every day to pay their bills, recharge their mobile phones, pay parking fees, and even play lottery numbers.