Operations | Monitoring | ITSM | DevOps | Cloud

June 2020

How to Enable PHP Error Reporting

Errors are undesirable for users and you should do everything in your control to keep users away from them. However, they are of utmost importance for developers. They allow developers to understand the inaccuracies and vulnerabilities in their code by alerting them when their code breaks. They also provide relevant information about what went wrong, where, and what can be done to make amends.

Better Python Decorators with Wrapt

Our instrumentation uses built-in extension mechanisms where possible, such as Django’s database instrumentation. But often libraries have no such mechanisms, so we resort to wrapping third party libraries’ functions with our own decorators. For example, we instrument jinja2 ’s Template.render() function with a decorator to measure template rendering time. We value the correctness of our instrumentation a lot so that we do not affect our users’ applications.

Video: Identifying Memory Bloat

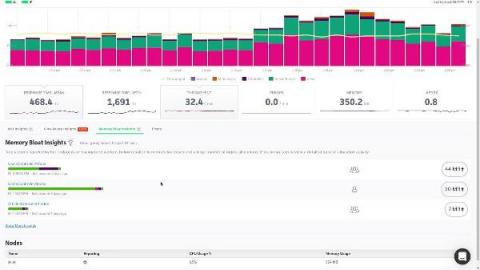
In this video, we are going to take a look at what memory bloat is, and how you can use Scout to eliminate it from your applications. Memory related performance issues have the potential to bring your entire application down, and yet, most APMs completely ignore this fact and fail to provide any useful way of monitoring memory usage at all.

The $5B DevOps Stranglehold

Ten years ago NewRelic, DataDog, Splunk, Dynatrace and SolarWinds built tools we loved to use. They were easy to implement and solved problems quickly and efficiently. Each company was known primarily for a single, well-conceived product. NewRelic’s APM. Splunk’s log file analyzer. DataDog’s server monitor. SolarWinds’ network performance monitor. These companies were beloved by users during the 2000s. Fast forward to 2020 and the world is very different.