Operations | Monitoring | ITSM | DevOps | Cloud

June 2020

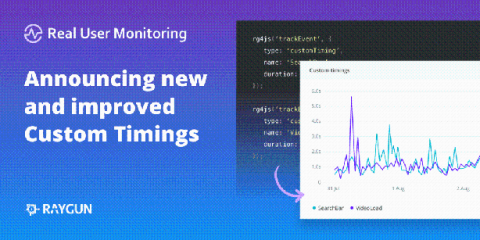
Track any web performance metric with improved custom timings for Real User Monitoring

Over the past few years, we’ve witnessed a couple of key trends in the performance monitoring space. Adoption of single-page applications (SPAs) has continued to grow and as such performance monitoring is evolving. SPAs don’t offer the same existing web metrics like load time or first paint from the browser performance API. As a result, developers require more flexibility to track the metrics that matter to their end-users and business.

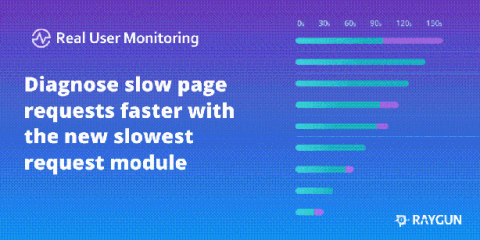
Diagnose slow page requests with the latest addition to RUM

Earlier in the year, we launched the request details page in Raygun Real User Monitoring. This update brought the instance-level insights into page performance to help you understand exactly what caused poor performance and how to improve it. To complement instance-level insights, this latest launch brings the Latest slowest requests module to Real User Monitoring. Now, when viewing performance data for a specific URI, you can easily jump into the instance-level diagnostics for a specific slow request.
Sponsored Post

Why high-performing teams consolidate monitoring tools with Raygun APM

Raygun helps thousands of software teams diagnose and resolve performance problems faster and more efficiently. We understand that in today's current climate, there is even more pressure on teams to ensure software quality across the whole stack, all while being cost-effective. It's no easy task! But we know that consolidating tools can help.