Operations | Monitoring | ITSM | DevOps | Cloud

October 2019

Screens Beta

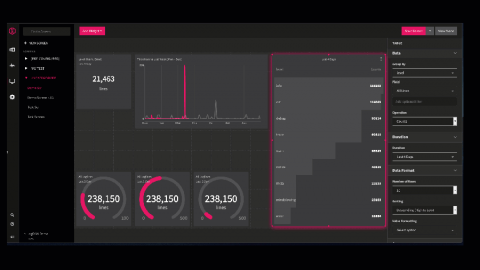
Screens display a series of widgets that you can use to share across your organization. Widgets can display your log activity, from the number of logs ingested in the last 4 hours, to a line graph comparing today’s logs to yesterday’s logs. You can control the data you want to display by creating a “Screen” with a combination of different widgets. Post your screen on a company monitor to provide your organization with a snapshot of your system’s activity.

LogDNA and IBM find synergy in cloud

You know what they say: you can’t fix what you can’t find. That’s what makes log management such a critical element in the DevOps process. Logging provides key information for software developers on the lookout for code errors. While working on their third startup in 2013, Chris Nguyen and Lee Liu realized that traditional log management was wholly inadequate for addressing data sprawl in the modern, cloud-native development stack.

IBM Log Analysis with LogDNA

IBM Cloud Log Analysis with LogDNA enables you to quickly find the source of issues and gain deeper insight into application and cloud environment data. IBM Cloud logging begins with log aggregation from application and services within IBM Cloud. IBM partners with LogDNA to bring collection, log tailing and blazing fast log search. LogDNA supports integrations to many cloud-native runtimes and environments.

Managing dynamic data flows across Elasticsearch clusters

Massively scaling free-text search has always been the holy grail in big data. Many software firms now face the burgeoning challenge of searching through previously untapped data sources and the current trend is far surpassing the petabyte scale. Here at LogDNA we manage free-text search for thousands of customers with distinct traffic profiles across a multitude of Elasticsearch clusters.