Operations | Monitoring | ITSM | DevOps | Cloud

November 2020

MetricFire vs. Datadog

Before we dive into the specifics of MetricFire vs. Datadog, let's address the most critical point: scaling. Datadog is great for users who need to do a little bit of everything, but Datadog's biggest weakness is scaling. Datadog can do logs, APM, time-series and more, but scaling time-series metrics, alerts, and servers will cause your monthly bill to escalate. The graph below shows what you pay at Datadog vs. MetricFire: Now, let's dive into MetricFire vs. Datadog, and their key comparisons.

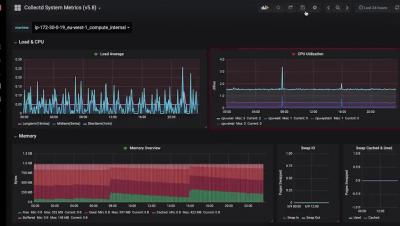
Grafana Tutorial: Automating Common Grafana Actions

Grafana is probably the most popular visualization software and a Hosted Grafana is provided by MetricFire. Every day, our users have to perform certain actions and most of them are repetitive. For example, you might want to automatically create a bunch of different folders with dashboards in them. This tutorial will show you how to do that with Terraform, which is very popular in the DevOps circles, and how to go even further by using the client library yourself to automate more.

Grafana vs Chronograf: Pricing

Grafana vs InfluxDB – Both offer their cloud services for storing, visualizing and alerting on any kind of time-series data. Both cloud offerings differ from each other in various ways and follow distinct pricing strategies. In this article, we cover the details of Grafana as a service and InfluxDB Cloud, their features and benefits along with their pricing models. MetricFire is a Hosted Grafana service, where you can use Grafana dashboards directly in the MetricFire platform.

Sending metrics to MetricFire

Monitoring IT resources is part of the daily activities in large and medium-sized companies, but smaller companies also benefit from the advantages of monitoring systems, memory capacity, availability, and performance. The aim of such proactivity is to ensure smooth processes - for example, IT administrators need to know days in advance that disk space is becoming too low, so they can do something about it.

Remote Prometheus Monitoring using Thanos

In a previous blog we learnt about setting up a Scalable Prometheus-Thanos monitoring stack. We also learnt about how we can cluster multiple Prometheus servers with the help of Thanos and then deduplicate metrics and alerts across them. MetricFire is a Hosted Prometheus solution, and you can use our product with minimal configuration to gain in-depth insight into your environments. If you would like to learn more about it please book a demo with us, or sign up for the free trial today.