Testing Kubernetes Ingress with Production Traffic
Testing Kubernetes Ingress resources can be tricky, and can lead to frustration when bugs pop up in production that weren’t caught during testing.
This can happen for a variety of reasons, but with Ingress specifically, it often has to do with a misalignment between the data used in testing and the traffic generated in production.
Tools like Postman can be a great way of generating traffic, but they have the drawback of being manually created. Not only is this unlikely to create all the needed variations for a single endpoint (different headers, different request bodies, etc.), it would be almost impossible to create all the needed variations, for all possible endpoints.
In reality, you can get far with manually generated traffic, but it’s unreasonable to think that you’ll ever fully replicate what’s happening in production. Not to mention the need for load generation if you need to test scaling.
Given how Ingress is the front door to your application, it is crucial to make sure it functions properly. If it’s not functioning properly, or is routing users to the wrong place, it will have an immense impact on the user experience.
This post will attempt to showcase how traffic replay may very well be one of the only ways to test Kubernetes Ingress fully.
Prerequisites
To follow along with the steps outlined in this post, there are a few prerequisites you will have to meet.
First, this post will use Minikube to set up a cluster and interact with it, and will include some Minikube-specific steps. However, if you are familiar enough with Kubernetes, you can also run your own cluster in any way you prefer.
Second, you will need to install Speedscale. If you’re unfamiliar with Speedscale and how it works, it’s recommended that you first check out this tutorial on how Speedscale works in general. However, simple instructions will be given later in this post.
While the steps in this post are specific to Speedscale and Minikube, the principles of using traffic replay for Ingress testing remain the same, no matter what combination of tools you use.
As such, a read-through of this post without following the steps should still allow you to garner a good understanding of how traffic replay can help you test Ingress in Kubernetes in general.
As you’ll be testing Ingress resources in this post, you will need to enable the Ingress Controller:
$ minikube addons enable ingressIf you are using a cluster other than Minikube, follow the installation instructions for Nginx that are relevant for you.
You’ll also have to enable the metrics-server, as it is used by Speedscale:
$ minikube addons enable metrics-serverFor clusters other than Minikube, enabling metrics-server is highly individual depending on your provider. You can verify if metrics-server is already enabled with kubectl get deploy,svc -n kube-system | egrep metrics-server.
Configuring Sample Service
Now you’ll have to set up a sample service that can receive traffic, which in this case will be Speedscale’s fork of podtato-head. To do this, start by cloning the repo and changing directory into the cloned directory:
$ git clone https://github.com/speedscale/podtato-head && cd podtato-head
Cloning into 'podtato-head'...
remote: Enumerating objects: 2743, done.
remote: Total 2743 (delta 0), reused 0 (delta 0), pack-reused 2743
Receiving objects: 100% (2743/2743), 8.05 MiB | 1.83 MiB/s, done.
Resolving deltas: 100% (1398/1398), done.
Now you can go ahead and deploy podtato-head by using the kubectl apply -f command:
$ kubectl apply -f delivery/kubectl/manifest.yaml
deployment.apps/podtato-head-entry created
service/podtato-head-entry created
deployment.apps/podtato-head-hat created
service/podtato-head-hat created
deployment.apps/podtato-head-left-leg created
service/podtato-head-left-leg created
deployment.apps/podtato-head-left-arm created
service/podtato-head-left-arm created
deployment.apps/podtato-head-right-leg created
service/podtato-head-right-leg created
deployment.apps/podtato-head-right-arm created
service/podtato-head-right-arm created
Verify that the Pods are running by using the kubectl get pods command. If any Pods are still in the ContainerCreating, wait a minute or so until your output resembles what you see below.
$ kubectl get pods
NAME                                      READY   STATUS    RESTARTS   AGE
podtato-head-entry-6cf776d64d-mbzmc       1/1     Running   0          53s
podtato-head-hat-6545645ccd-mm7zx         1/1     Running   0          53s
podtato-head-left-arm-5c85c9b974-hgjz7    1/1     Running   0          53s
podtato-head-left-leg-65f688cf6b-pq5qh    1/1     Running   0          53s
podtato-head-right-arm-77bdc79654-jlqmm   1/1     Running   0          53s
podtato-head-right-leg-69d78f5c54-d6zkk   1/1     Running   0          53s
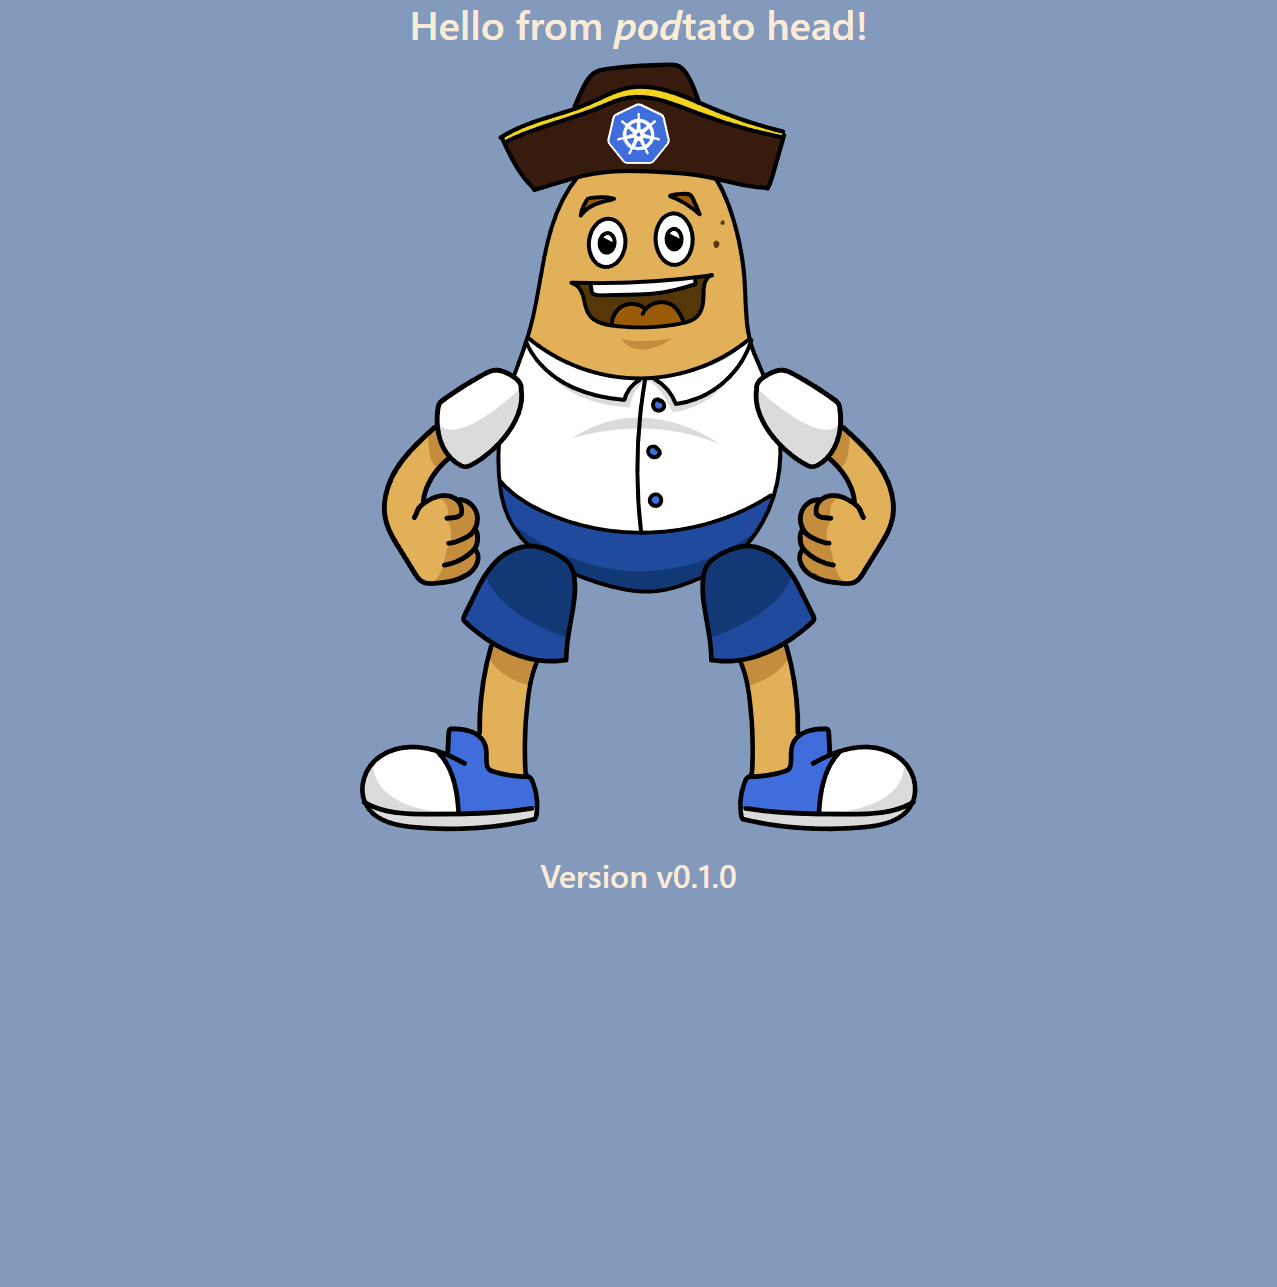
Once all Pods are running, you can verify that the application works as expected. podtato-head receives traffic on port 31000 on the podtato-head-entry service. So to test the application, forward port 31000 to any unprivileged port, for example port 8080:
$ kubectl port-forward svc/podtato-head-entry 8080:31000Now open up your browser to localhost:8080 and you should see the following:
At this point, you now have a running application in your cluster that is capable of receiving traffic. But, you want to make this accessible through an Ingress, instead of using port-forward. To do this, you first have to enable a tunnel in Minikube. This tunnel will provide you with an IP that you can use to send requests to the Ingress Controller in your cluster.
$ minikube tunnelNote that the IP will be different when using Docker Desktop compared to Docker Engine. For Docker Desktop users, you will have to send requests to localhost. Docker Engine users, on the other hand, will have to send requests to the IP output by the minikube tunnel command (most commonly 192.168.49.2). From here on, 192.168.49.2 will be used as the example IP.
At this point, you can verify the tunnel by sending a request to the minikube IP. Make sure to use another terminal window, as the one used for the minikube tunnel command has to stay open:
$ curl 192.168.49.2
<html>
<head><title>404 Not Found</title></head>
<body>
<center><h1>404 Not Found</h1></center>
<hr><center>nginx</center>
</body>
</html>
Getting a 404 error is completely normal here, since you’ve yet to configure any backend for the controller. So, let’s do that now! Save the following to a file named ingress.yaml:
apiVersion: networking.k8s.io/v1
kind: Ingress
metadata:
  name: podtato-head-ingress # name of Ingress resource
  annotations:
    nginx.ingress.kubernetes.io/rewrite-target: /$1
spec:
  rules:
    - host: podtato-head.info # hostname to use for podtato-head connections
      http:
        paths:
          - path: / # route all url paths to this Ingress resource
            pathType: Prefix
            backend:
              service:
                name: podtato-head-entry # service to forward requests to
                port:
                  number: 31000 # port to use
This will deploy an Ingress resource to forward requests to your podtato-head application. Deploy it by using the kubectl apply command:
$ kubectl apply -f ingress.yamlNow wait until the Ingress resource has been assigned an address:
$ kubectl get ingress
NAME                   CLASS   HOSTS               ADDRESS        PORTS   AGE
podtato-head-ingress   nginx   podtato-head.info   192.168.49.2   80      8d
At this point, you should be able to access podtato-head through the Ingress resource, which you can verify with curl:
$ curl -H "Host: podtato-head.info" 192.168.49.2
<html>
  <head>
    <title>Hello Podtato!</title>
    <link rel="stylesheet" href="./assets/css/styles.css"/>
    <link rel="stylesheet" href="./assets/css/custom.css"/>
  </head>
  <body style="background-color: #849abd;color: #faebd7;">
    <main class="container">
      <div class="text-center">
        <h1>Hello from <i>pod</i>tato head!</h1>
        <div style="width:700px; height:800px; margin:auto; position:relative;">
          <img src="./assets/images/body/body.svg" style="position:absolute;margin-top:80px;margin-left:200px;">
          <img src="./parts/hat/hat.svg" style="position:absolute;margin-left:200px;margin-top:0px;">
          <img src="./parts/left-arm/left-arm.svg" style="position:absolute;top:100px;left:-50px;">
          <img src="./parts/right-arm/right-arm.svg" style="position:absolute;top:100px;left:450px;">
          <img src="./parts/left-leg/left-leg.svg" style="position:absolute;top:480px;left: -0px;" >
          <img src="./parts/right-leg/right-leg.svg" style="position:absolute;top:480px;left: 400px;">
        </div>
        <h2> Version v0.1.0 </h2>
      </div>
    </main>
  </body>
</html>%
If you’re not familiar with the -H "Host: podtato-head.info" part of this curl command, this is a way to specify the Host header, which is what the Ingress Controller uses for its matching algorithm, subsequently determining where to forward the request.
You’ll notice that this matches line 9 in the ingress.yaml file.
At this point, the sample application should be working, and you can start to capture traffic.
Capturing Traffic With Speedscale
To capture traffic with Speedscale, you first need to sign up for a free account. From here you can enter the Speedscale WebUI, where you’ll find a quick start guide. For simplicity’s sake, here are the instructions you’ll need.
First, install the speedctl tool with Homebrew:
$ brew install speedscale/tap/speedctlNow, initilize the speedctl tool. To do this you’ll need your API key, which you can find in the quick start guide in the Speedscale WebUI.
$ speedctl initAt this point, you’re done configuring the speedctl tool, and you can now install the Speedscale Operator in your cluster using the speedctl install command.
$ speedctl installFollow the instructions in the wizard for the installation. Assuming the install was successful, Speedscale will now capture any traffic sent to the podtato-head application. To generate traffic, use the following while loop to send a request every half second. Let this run for at least a minute or so.
$ whiletrue; curl podtato-head.info; sleep 0.5; doneBy opening the service in Speedscale’s traffic viewer, you should be able to see the requests being captured.
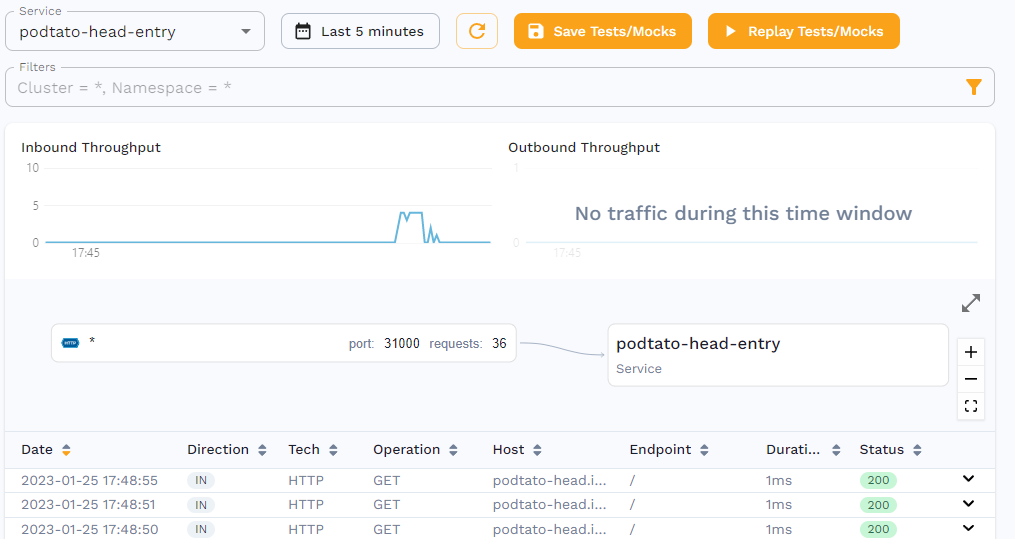
To use this traffic, save it as a snapshot, by clicking the "Save Tests/Mocks" button, which should bring you to the following page.
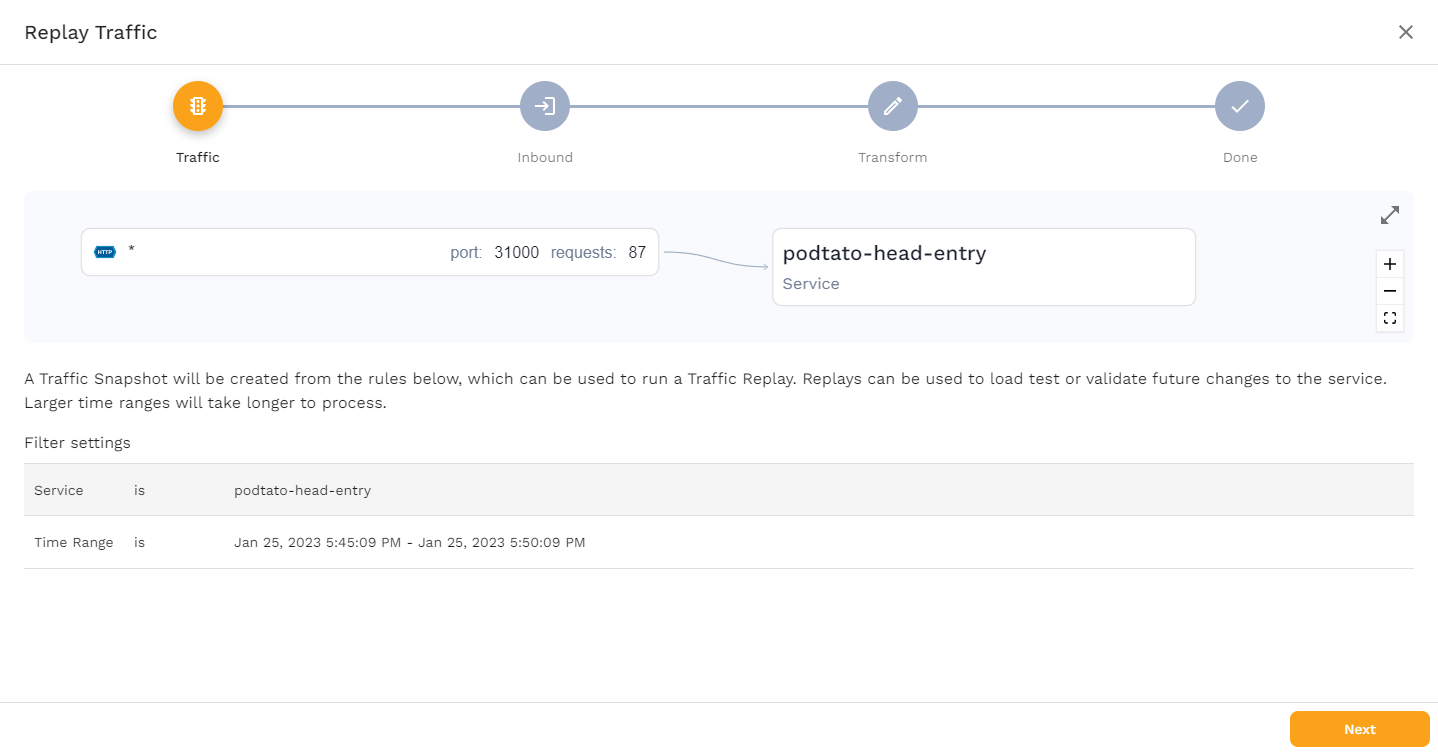
This page shows you what Service is being used, and how the traffic flows. Click "Next" to see the following screen.
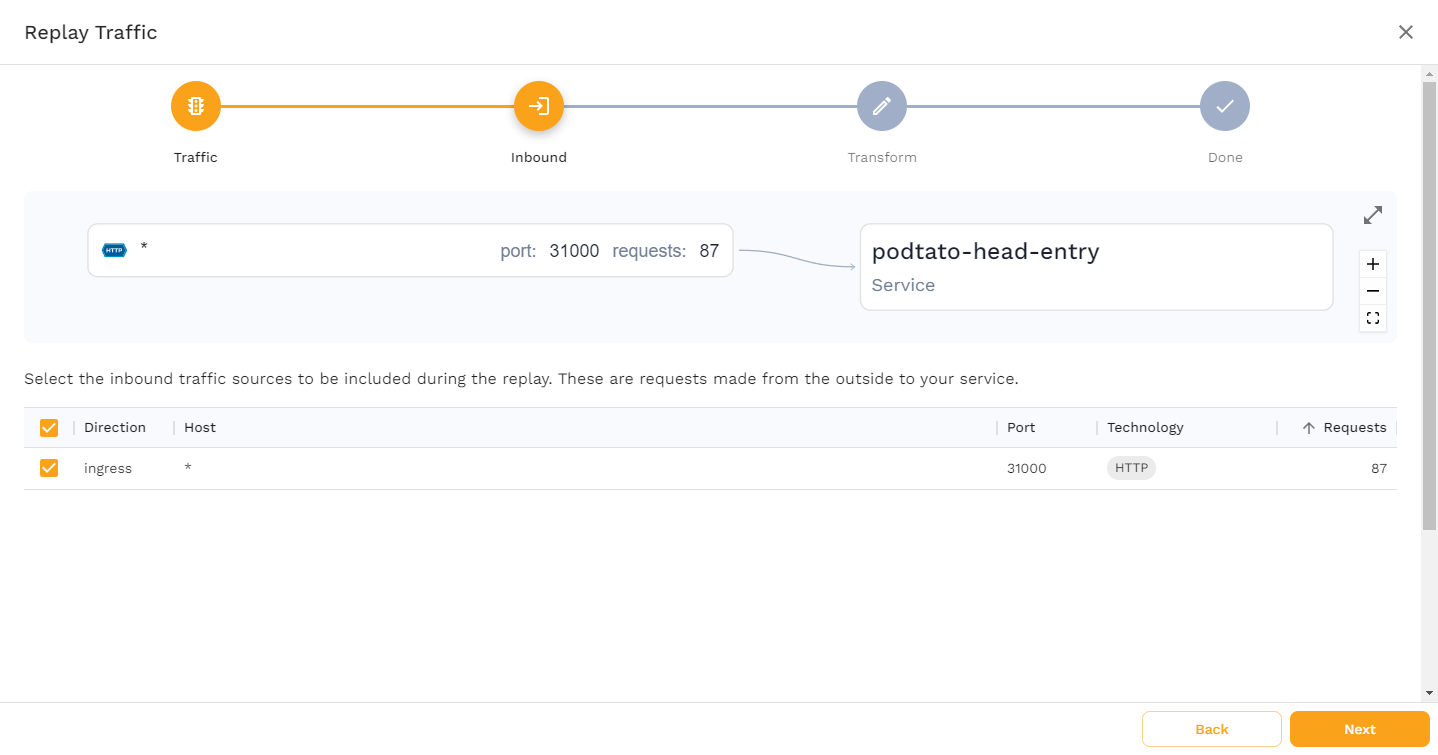
This page shows you what traffic Speedscale has captured. In this case, only incoming requests to port 31000 have been captured, which is exactly what we would expect. Click "Next".
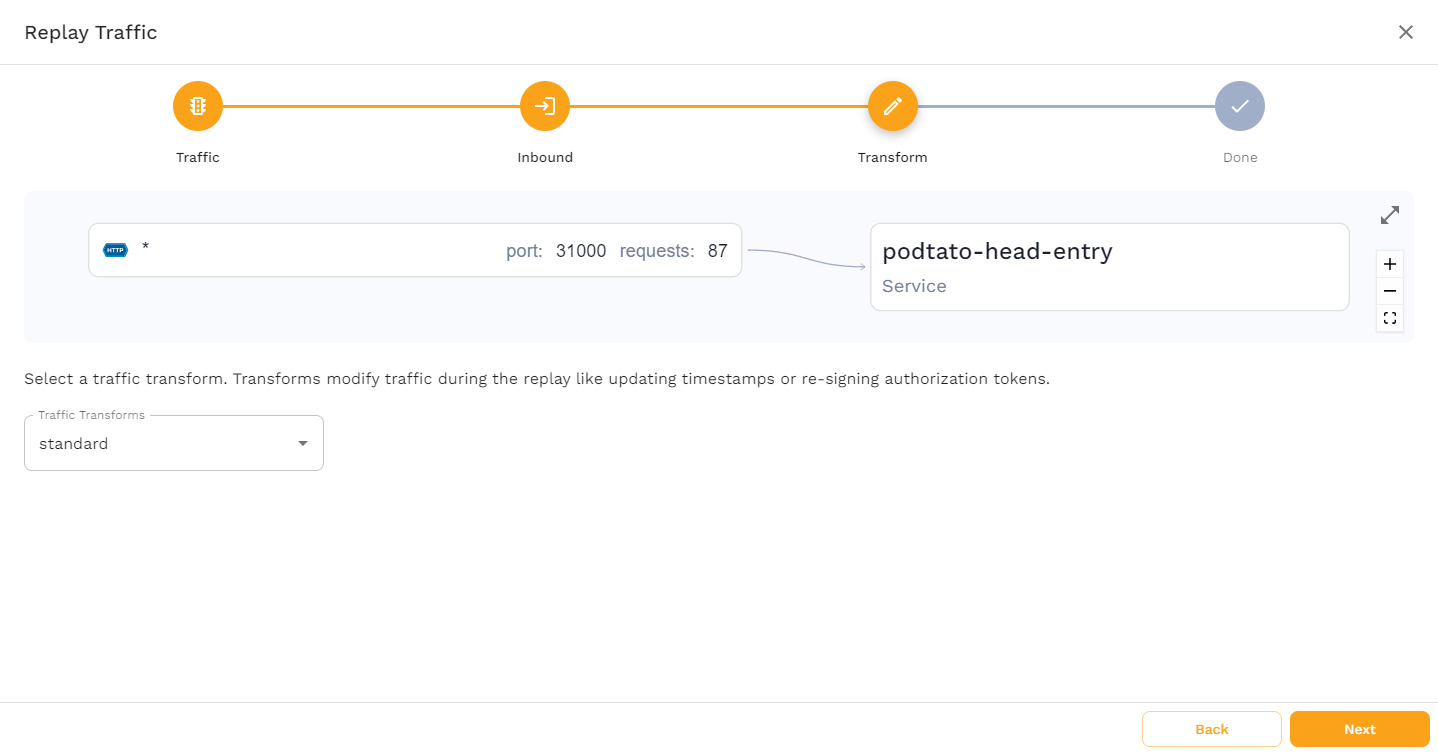
On this page, you’re able to choose any Transforms you may want applied to the traffic. This tutorial only requires the standard transform, so go ahead and click "Next".
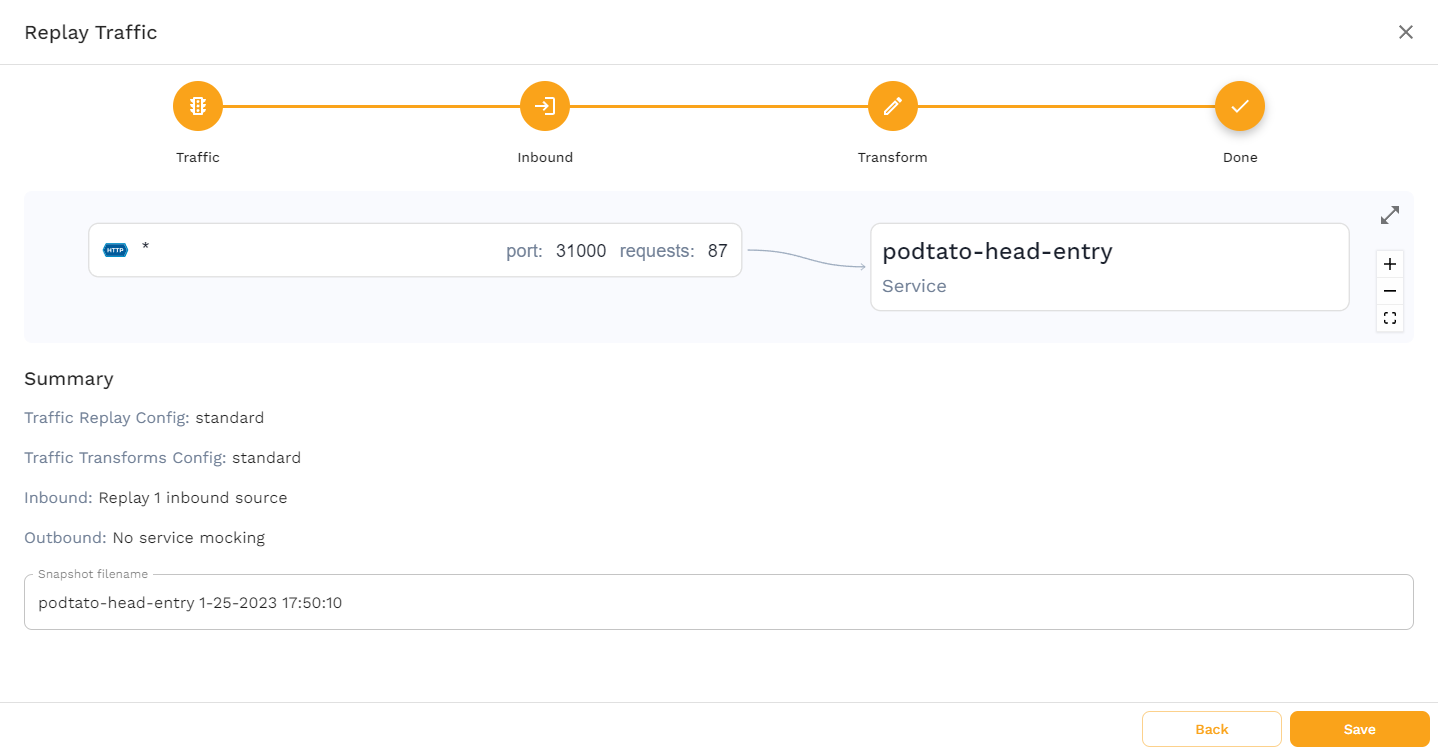
This last page gives you a summary of how you’ve configured the snapshot, and allows you to change the name of the snapshot. No changes are needed here, so click "Save" to finish the snapshot creation.
At this point, you’ve got a running application, and a snapshot containing the traffic that’s been sent to it. Now it’s time to see how you can test your Ingress by replaying the traffic.
Testing Ingress
First, you should verify that the snapshot works as expected. To do this you’ll need to grab the snapshot-id. Click on the Snapshots tab in the left-hand menu, then click on your snapshot, and you’ll find the snapshot-id in the URL.
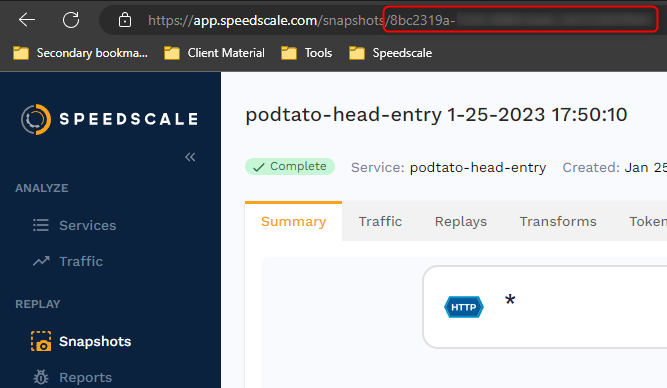
To replay the traffic you can either use the WebUI, or you can initiate it with the speedctl CLI tool. To use the CLI tool, run the following command:
$ speedctl infra replay --test-config-id standard \
    --cluster minikube \
    --snapshot-id <snapshot-id> \
    -n ingress-nginx \
    ingress-nginx-controller
Make sure to replace the id. The last two lines of this command are specifying the namespace ingres-nginx and the Service ingress-nginx-controller. If you’re replaying the snapshot through the WebUI, it’s important to make sure that this is the chosen Service, as Speedscale also allows you to replay the traffic directly to the podtato-head-entry Service, which would circumvent the Ingress resource and make this test useless.
After a few seconds, the command should output a new id, which is the id of the report. You can now check this report to make sure the replay was successful.
Note that the following command uses jq to parse the json output of the speedctl analyze report command. Make sure to install this tool; for example, by running brew install jq.
$ speedctl analyze report <report-id> | jq '.status#039;
"Passed"You may experience an output message stating that the report is still being analyzed, in which case you’ll just have to wait a bit and try again. Because of the low traffic, this shouldn’t take more than a minute.
Once the report is done being analyzed, you should see the output "Passed". This verifies that the replay fulfills the assertions set by the standard config, which essentially states that the traffic returned during the replay should match the captured traffic.
Now it’s finally time to see how Speedscale can help you test the Ingress resource. There are many different ways Speedscale can help you test Ingress:
- Verify response times
- Verify number of requests to certain endpoints
- Verify performance, i.e., transactions per second
And many more. In this case, you’ll simulate a scenario where your Ingress resource is failing. Do this by deleting it with the kubectl delete command.
$ kubectl delete -f ingress.yamlNow you can replay the snapshot again.
$ speedctl infra replay --test-config-id standard \
    --cluster minikube \
    --snapshot-id <snapshot-id> \
    -n ingress-nginx \
    ingress-nginx-controller
This will output a new id, which you can then analyze:
$ speedctl analyze report f4f7a973-3457-4586-b316-2f6a6d671c62 | jq '.status'
"Missed Goals"
This time you’ll see that the output is showing "Missed Goals", indicating that something went wrong. If you open the report in the WebUI, you’ll see that this was caused by 404 responses. This is exactly as expected, as the Ingress Controller no longer knows where to send the traffic.
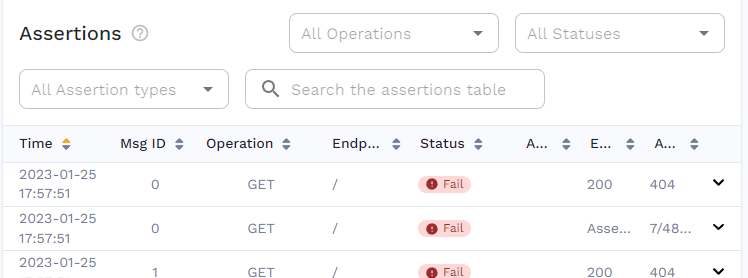
This is also a great example of how snapshot replays can be implemented in CI/CD pipelines, as it’s easy to perform a simple check on the output of the speedctl analyze report command.
Is Traffic Replay the Optimal Approach?
In this post, you’ve seen just a simple example of how traffic replay can help you test your Ingress resources, but this is only the tip of the iceberg.
Here you’ve seen an example of traffic being replayed within the same cluster; however, Speedscale allows you to replay traffic anywhere that the Operator is installed. Meaning, you can easily capture traffic in your production environment, and replay it in staging or development.
Not only does this allow you to use realistic data when testing new configuration changes (thereby increasing the validity of testing), it also makes it easy to use up-to-date and relevant data.
With the increasing focus on data regulations, such as GDPR, sharing data between production and development may concern you. However, with Speedscale’s focus on only storing desensitized, PII-redacted traffic, and with its single-tenant, SOC2 Type 2 certified architecture, you can be sure that any captured traffic is safe and compliant.
All in all, while there may likely be some use cases where traffic replay isn’t the optimal approach, there are many cases where it’s at least a valid consideration. If you’re still on the fence about traffic replay as a whole, you may want to check out the write-up on how traffic replay fits into production traffic replication as a whole.

