
The Observability Challenge: Limitations of the Human Brain

As software systems get more complex, the term Observability is increasingly being used alongside more familiar ones like “Monitoring”. In fact, the terms are not synonymous – they mean slightly different things. Monitoring is the act of watching a system to keep tabs on its overall health – in other words keeping an eye on the symptoms so you know when something needs attention.
Observability is the act of inferring the internal state of the system based on externally visible symptoms. In other words, it is supposed to inform you why you are seeing the symptoms you are seeing, particularly when things go wrong. The reality is that hardly any self-described observability tools fulfill that part of the promise (show you the why). But trends in software complexity, scale, and speed mean we need this missing piece now more than ever. And automated root cause analysis is the key to getting there.
Background
Contemporary monitoring strategies follow the black box approach to monitoring (first popularized by Google’s SRE team). The idea is that since software systems are so complicated, it would be very hard to monitor everything that occurs within the system. Instead, we can simplify our task by focusing on externally visible symptoms that matter – the golden signals of monitoring – latency, traffic, errors, and saturation. Just like checking temperature and blood pressure tell us when to worry about an individual’s health, these golden signals allow us to know when something is wrong and needs attention.
The Challenge: Something broke, but what the heck happened?
The challenge is what needs to happen next. As part two of this series will explain, the troubleshooting process involves a lot of digging into metrics, traces, and logs.
For a simple problem (like a crashed server, or memory/CPU starvation), this process can be fairly quick. But for a more complex problem, this “troubleshooting” process is far from quick – it can consume hours of skilled engineer’s time, while users are impacted.
The challenge is not the tools, or their ability to collect the data – modern tools allow you to centralize data effectively. Nor is the problem with the speed of searching or analyzing large quantities of data – tools are getting faster and more scalable so they can certainly keep up with data growth.
The challenge is that the scale, complexity, and speed of change in software are all growing so fast that it takes a team of humans time to know even what to look for or where to start. The bottleneck is now the human brain, which isn’t getting faster.
A decade ago, you had a monolithic software architecture, with tens of log files or metric streams to keep an eye on. When it broke, there were typically only a few hundred ways failures could occur. And you had weeks, if not months, to roll out changes so you had time to learn about failure modes and what to look for.
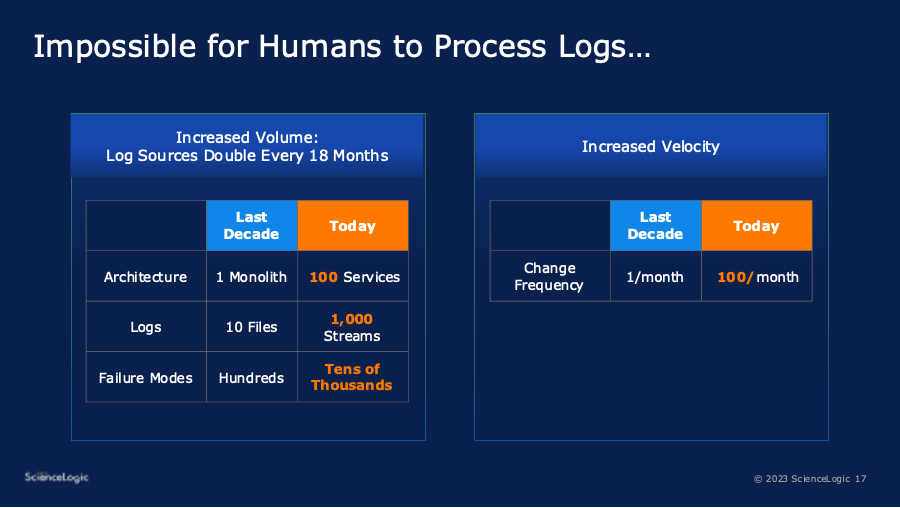
Today, software is increasingly horizontal – a distributed spider web of inter-related micro-services. This complexity means that there might be thousands of failure modes. It also means data volume is exploding, and you might have to look through thousands of log streams when troubleshooting. And the accelerating speed of new deployments means change is constant, so there simply isn’t time to learn about all these possible problems.
So, the challenge now is that humans need help to even know where to look, or what to look for. And if AI/ML can actually show us root cause, that is truly getting you to the promise of observability. Part two of this series will describe what automated RCA actually does. And part three will describe how these fits into ScienceLogic’s over-arching AIOps strategy.
Want to learn more about Zebrium? Request a free trial>