
Kubernetes Load Test Tutorial

In this blog post we use podtato-head to demonstrate how to load test kubernetes microservices and how Speedscale can help understand the relationships between them. No, that’s not a typo, podtato-head is an example microservices app from the CNCF Technical Advisory Group for Application Delivery, along with instructions on how to deploy it in numerous different ways:
- Direct deployment with kubectl
- Templated deployment with kustomize, helm, etc.
- Using gitops with argocd, flux
There are more than 10 delivery examples, you will surely learn something by going through the project. We liked it so much we forked the repo to contribute our improvements here:
https://github.com/speedscale/podtato-head
Getting minikube
First off, let’s install minikube and then run it with options to enable pod-to-pod network traffic. I’m using an Intel Mac, so I’ll download that binary.
curl -LO https://storage.googleapis.com/minikube/releases/latest/minikube-darwin-amd64
sudo install minikube-darwin-amd64 /usr/local/bin/minikube
Next, we’ll start minikube with the container networking interface (CNI) networking option enabled. Without this, traffic between pods within the Kubernetes network won’t flow by default. Again, because I’m using a Mac, I’m installing the hyperkit driver to run Kubernetes inside of a virtual machine. Tune the memory, CPUs, and disk size allocated to the VM to suit your needs and hardware.
<span data-selectable-paragraph="">brew install hyperkit
minikube start --cni=true --vm=true --memory=8g --cpus=4 --disk-size=128g</span>
Simple Delivery Option
I picked the kubectl option because:
- To interact with Kubernetes, you need
kubectl(so no additional tools have to be installed) - There are also no dependencies on the cluster
This is all it takes to deploy onto my minikube cluster:
kubectl apply -f https://raw.githubusercontent.com/speedscale/podtato-head/main/delivery/kubectl/manifest.yamlDouble check that your pods are running:
kubectl get podsThis automatically deployed a load balancer, but you need to note it is http and it is listening on port 31000.
LB=$(minikube ip)
echo$LB
Now, on my Mac I was able to see it in the browser with:
open http://${LB}:31000You should see a friendly face with all four of his limbs!
Install Speedscale on podtato
If you are curious how the microservices are built, you can use Speedscale to intercept the calls and understand what is calling what. If you don’t have Speedscale already you can sign up for a Free Trial here. Once you have speedctl on your machine, you can use it to install the control plane on your cluster:
speedctl installFollow the default prompts to put the sidecar on everything in the podtato-kubeclt namespace:
 Deployments patched.
 Patched default/podtato-head-entry
Patched default/podtato-head-hat
Patched default/podtato-head-left-arm
Patched default/podtato-head-left-legp
Patched default/podtato-head-right-arm
Patched default/podtato-head-right-leg
Patched default/podtato-head-entry
Patched default/podtato-head-hat
Patched default/podtato-head-left-arm
Patched default/podtato-head-left-legp
Patched default/podtato-head-right-arm
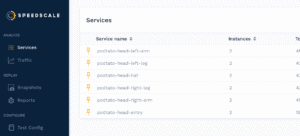
Patched default/podtato-head-right-legOnce you exercise your application, you should see the various services on your home page like so:
Drill Down for API Visibility
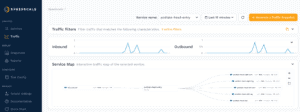
When you click into the podtato-head-entry you can see a map which shows the relationship of the various services. The entry service is responsible for fetching images from all of the other services which you can clearly see in the service map:
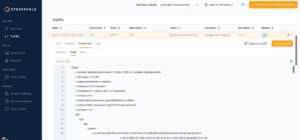
Going down into the table you can see exactly what the call is from the entry service to each outbound API. It is actually fetching the SVG of the image that is shown on the home page. In your own apps, you can use this drill down to inspect what is being sent and received between your internal and external services. Perhaps a SaaS endpoint changed the body of responses and your current libraries aren’t up-to-date – Speedscale’s traffic viewer can help diagnose the issue.
By using this observed traffic, we ran replay as a load and performance test scenario to understand the limits of our kubernetes cluster. Click on the Snapshot button and this portion of traffic will be analyzed and stored for future use.
Load Test Kubernetes with Traffic Replay
Now running a replay of that snapshot is as simple as applying a patch file. Note that this patch refers to the original traffic snapshot (yours will have a specific unique id), and it also references a test config to run through the traffic at 10x what was originally recorded. Feel free to try out a few variations of the test config for different load patterns. These patterns are stored in customizable test configurations that can help you load test your application, or transform traffic to generate chaos tests for test and staging environments.
apiVersion: apps/v1
kind: Deployment
metadata:
 name: podtato-head-entry
 annotations:
 test.speedscale.com/scenarioid: UUID
 test.speedscale.com/testconfigid: performance_10replicas
 test.speedscale.com/cleanup: "false"
 sidecar.speedscale.com/inject: "false"
Running the replay is as simple as:
kubectl patch deployment podtato-head-entry --patch-file patch.yamlWe can check for the Speedscale pods during our run by checking the namespace. These will disappear once testing is done.
kubectl get podsAfter replaying the traffic, the testing pods will disappear and we should be able to see our replay from our traffic screen. They may take a moment to process depending on how much traffic you sent. First though, at the top of the page, you can see how requests for the different parts of the image were sent to your various backend services. This can be useful when trying to track down service dependencies in your own application; maybe there’s an old application that you rely on that everyone thought was decommissioned, but it’s still sending and receiving traffic.
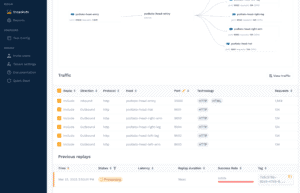
Next, clicking on the replay will take you to a replay report.
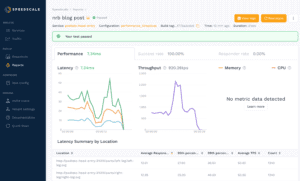
Here, you can see metrics such as the average latency of requests, throughput, and a breakdown by endpoint tested. Memory and CPU usage are collected if the Kubernetes metrics server is installed and configured, which we did not do in this demo. Using latency, throughput, and hardware metrics can be helpful in identifying slow services or endpoints, or for identifying the best cost-to-performance hardware for your application.
Wrapping up
Hopefully this demonstration is useful in understanding how quickly you can load test kubernetes microservices and how Speedscale can help understand the relationships between them! We encourage you to sign up for a free trial and test it out in your own environment today!