Operations | Monitoring | ITSM | DevOps | Cloud
Dynamic Sampling by Example
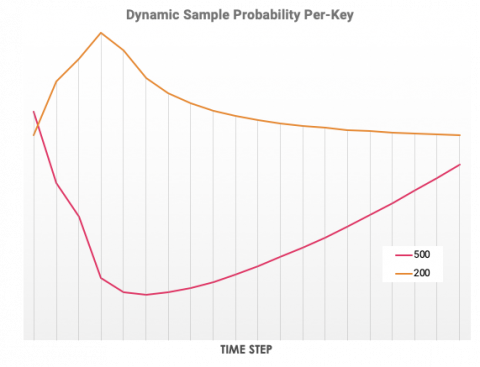
Last week, Rachel published a guide describing the advantages of dynamic sampling. In it, we discussed varying sample rates to achieve a target collection rate overall, and having different sample rates for distinct kinds of keys. We also teased the idea of combining the two techniques to preserve the most important events and traces for debugging without drowning them out in a sea of noise.
Stop Your Database From Hating You With This One Weird Trick
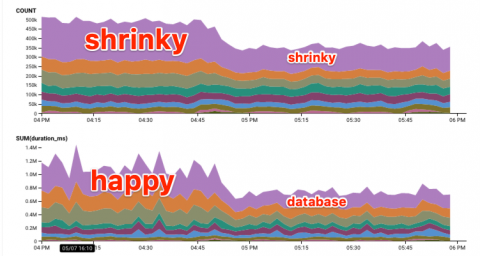
Let’s not bury the lede here: we use Observability-Driven Development at Honeycomb to identify and prevent DB load issues. Like every online service, we experience this familiar cycle. This is not a bad thing! It’s a normal thing. Databases are easy to start with and do an excellent job of holding important data.
The New Rules of Sampling
One of the most common questions we get at Honeycomb is about how to control costs while still achieving the level of observability needed to debug, troubleshoot, and understand what is happening in production. Historically, the answer from most vendors has been to aggregate your data–to offer you calculated medians, means, and averages rather than the deep context you gain from having access to the actual events coming from your production environment.
When In Doubt, Add More Spans: A Tale of Tracing and Testing In Production
Recently, Toshok was telling a story about the kind of thing he talks about a lot—improving the performance of some endpoint or page or other. Obviously, we spend a lot of time thinking about how to improve the experience of our users, but what caught my attention this time was that what he was describing sounded like a new kind of testing in production—so I asked him to go into a bit more detail.
Incident Review: Caches are Good, Except When They Are Bad
Between Wednesday, April 17th and Friday, April 26th, Honeycomb had four separate periods of downtime affecting the Honeycomb API, resulting in approximately 38 minutes of total downtime. At Honeycomb, we believe that visibility into production services is important, especially when service outages are making your users unhappy. We take the impact of outages on our customers seriously, and believe that transparency is key to you trusting in and using our service.


