Operations | Monitoring | ITSM | DevOps | Cloud

July 2022

How to Manage Your Data Center During a Heatwave

The recent heatwave that brought record temperatures to the UK caused cooling systems to fail at a London data center resulting in downtime for Google and Oracle. According to Oracle, “Following unseasonably high temperatures in the UK south (London) region, two cooler units in the data centre experienced a failure when they were required to operate above their design limits.

Data Center Analytics: Top KPIs Chosen by Experts

Today’s data centers generate a lot of data. Intelligent rack PDUs and other metered power infrastructure, environmental sensors, and the constant change in modern data centers all contribute towards a massive volume and variety of data. But data center professionals don’t have the time to collect all the data from its sources, analyze it, and derive insights from it that improve their data center operations.

Rack Diagrams: Why You're Doing Them Wrong

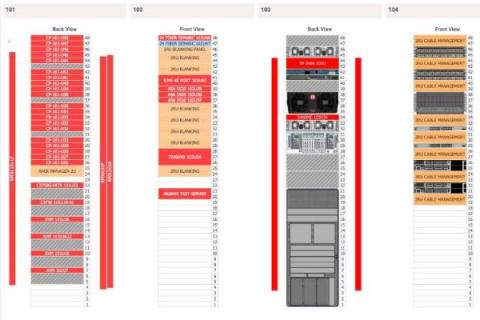
Rack diagrams, also known as rack elevations, are visual representations of the IT equipment in a server rack. They are used to track and manage what assets are in each rack and which U position they are in. Rack diagrams are very useful and commonly used for data center asset management and capacity planning. The information rack diagrams provide allow you to know what equipment you have, where you have space to deploy more, and can improve the troubleshooting process.