Operations | Monitoring | ITSM | DevOps | Cloud
Monitoring Kubernetes Clusters on GKE (Google Container Engine)
The Kubernetes ecosystem contains a number of logging and monitoring solutions. These tools address monitoring and logging at different layers in the Kubernetes Engine stack. This document describes some of these tools, what layer of the stack they address, as well as best practices for implementation including an example from the field, a quick start, and a demo project.
Downsampling and Exporting Stackdriver Monitoring Data
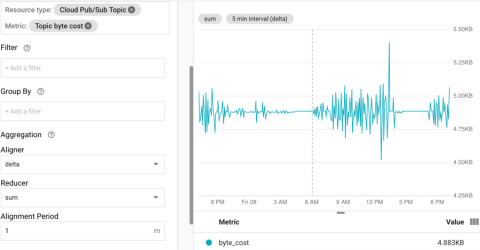
Stackdriver Monitoring contains a wealth of information about cloud resource usage, both for Google Cloud Platform (GCP) and and other sources. This post will explain how to use the Stackdriver Monitoring API to read, downsample, and export data from Stackdriver to BigQuery. Pub/Sub metrics will be used to demonstrate this.
The service mesh era: Using Istio and Stackdriver to build an SRE service
Just to recap, so far our ongoing series about the Istio service mesh we’ve talked about the benefits of using a service mesh, using Istio for application deployments and traffic management, and how Istio helps you achieve your security goals. In today’s installment, we’re going to dig further into monitoring, tracing, and service-level objectives.


