Operations | Monitoring | ITSM | DevOps | Cloud

May 2018

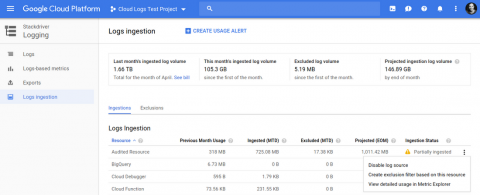
Gain visibility and take control of Stackdriver costs with new metrics and tools

A few months back, we announced new simplified Stackdriver pricing that will go into effect on June 30. We’re excited to bring this change to our users. To streamline this change, you’ll receive advanced notifications and alerting on the performance and diagnostics data you track for cloud applications, plus flexibility in creating dashboards, without having to opt in to the premium pricing tier.

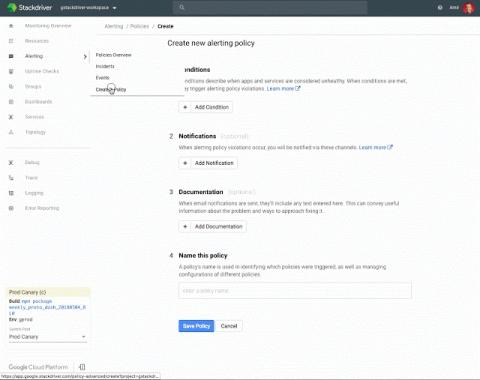
Stackdriver brings powerful alerting capabilities to the condition editor UI

We are excited to announce the beta version of our new alerting condition configuration UI. In addition to allowing you to define alerting conditions more precisely, this new UI provides an easier, more visual way to find the metrics to alert on. The new UI lets you use the same metrics selector as used in Stackdriver’s Metrics Explorer to define a broader set of conditions. Starting today, you can use that metrics selector to create and edit threshold conditions for alerting policies.

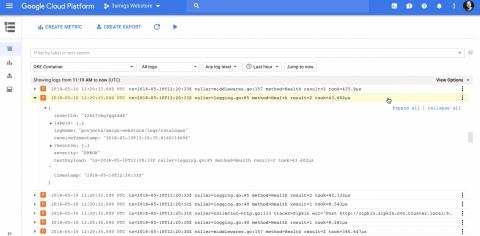
Getting more value from your Stackdriver logs with structured data

Logs contain some of the most valuable data available to developers, DevOps practitioners, Site Reliability Engineers (SREs) and security teams, particularly when troubleshooting an incident. It’s not always easy to extract and use, though. One common challenge is that many log entries are blobs of unstructured text, making it difficult to extract the relevant information when you need it.

Announcing Stackdriver Kubernetes Monitoring: Comprehensive Kubernetes observability from the start

Today, we are excited to announce the beta release of Stackdriver Kubernetes Monitoring, which lets you observe Kubernetes in a comprehensive fashion, simplifying operations for both developers and operators.