Speedscale Launches CLI: Free API Observability Tool
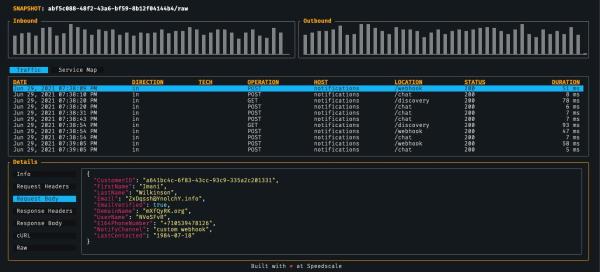
We are excited to announce the launch of Speedscale CLI, a free observability tool that inspects, detects and maps API calls on local applications or containers. The offering underscores the importance of continued and proactive API testing to quickly detect and debug defects within a shifting array of upstream and downstream interdependencies.
“Customers such as Grofers and Nylas have made it clear that fixing defects during development costs a fraction of what it costs to track down problems in production. However, shifting detection left can slow the CI/CD process considerably unless developers have a clear understanding of what’s under every API’s hood and how code changes impact their operations,” said Ken Ahrens, co-founder and CEO of Speedscale. “We’re offering Speedscale CLI at no charge because we recognize that API visibility is the foundation all cloud native developers need to validate functionality and correct defects before the code is released.”
While the goal of CI/CD is to deploy applications rapidly and continuously, only 15% of DevOps leaders report their organization deploys even once per day, a recent CloudBolt Software report shows. To keep pace with cloud native deployment timeframes, SaaS companies need modern QA tools that enable developers to cut time and eliminate errors in the Kubernetes and container-delivery pipeline.
Speedscale addresses the quintessential struggle cloud native developers face: how to test APIs during CI/CD while keeping pace with shifting production environments.
Free Product Capabilities
Speedscale CLI is a desktop tool that offers the following features:
- Service Mapping, enabling developers to auto-detect and map external dependencies that could break in production, without having to send their data anywhere.
- Traffic viewer, for logging and tracing API calls into and out-of an API that’s under development. Oftentimes headers, cookies, message bodies and authentication can be difficult to understand — especially in complex protocols such as gRPC.
- Latency detection, allowing users to understand which API calls are slow and how code changes impact performance in order to focus optimization efforts.
- Load generation, coming soon, enables users to run mini load tests locally.
Speedscale’s commercial product supplements CLI’s observability capabilities with automated API-level testing, automated mock-environment creation and report generation. Replaying sanitized production traffic, and spinning up mock environments and reports, enable developers to validate code and pinpoint defects at the speed of cloud native development before the code gets deployed.
“Speedscale gives cloud native developers the clarity we need to understand what APIs are doing and how they’re performing. Its fast, deep inspection of API calls is what allows us to roll out frequent, large-scale, quality upgrades to our cloud architecture,” said David Ting, Nylas SVP of Engineering, CISO. “Speedscale is the backbone of our performance benchmarking strategy, and the ROI we’ve achieved is huge.”
Developers interested in learning more about Speedscale CLI can register for a live webinar on January 12th at 2 pm ET.
View a demo video below or visit our CLI page with full product details and specs.
- Speedscale CLI documentation
- Speedscale Commercial data sheet
About Speedscale
Speedscale helps Kubernetes engineering teams validate how new code will perform under production-like workload conditions. Speedscale provides unparalleled visibility, collects and replays API traffic, introduces chaos, and measures the golden signals of latency, throughput, saturation and errors before the code is released. Speedscale Traffic Replay is a modern load, integration, and chaos testing framework — an alternative to legacy scripting tools which can take days or weeks to run and do not scale well for modern architectures. For more information, visit speedscale.com.

