
5 ELK Stack Pros and Cons

Is your organization currently relying on an ELK cluster for log analytics in the cloud?
While the ELK stack delivers on its major promises, it isn’t the only search and analytics engine — and may not even be your best option for log management. As cloud data volumes grow, ELK monitoring can become too costly and complex to manage.
Fast-growing organizations should consider innovative alternatives offering better performance at scale, superior cost economics, reduced complexity and enhanced data access in the cloud.
In this blog post, we explore the most important pros and cons of leveraging an ELK stack for log analytics. We’ll highlight the key features and benefits that have driven ELK stack adoption, along with the critical drawbacks that drive organizations away from ELK and towards more powerful ELK stack alternatives.
What is an ELK Stack?
If you’re already running an Elastic stack, you’re probably familiar with the basic components of the ELK Stack and how they work together.
If not, you may be wondering, what does ELK even mean?
Here’s a quick review of how the ELK stack works.
The ELK Stack is an open-source log analytics solution with three software components: Elasticsearch, Logstash, and Kibana. Working together, these technologies allow DevOps and SecOps teams to collect, aggregate, analyze, and visualize log data in the cloud, supporting critical functions like application monitoring and security analytics.
Here’s what each of these software tools brings to the table:
Elasticsearch
First released in 2010, Elasticsearch is a distributed, open-source search and analysis engine based on Apache Lucene, a java-based search engine library with full text indexing capabilities. IT operations teams use Elasticsearch to index, search, and analyze log data from cloud-based applications at scale. Data that enters Elasticsearch can be parsed, normalized, and enriched before being indexed.
Logstash
Elasticsearch allows users to index, search and analyze data, but that data needs to make its way into Elasticsearch before it can be utilized - and that’s where Logstash comes in.
Logstash is an open-source data collection engine that acts as a data pipeline for Elasticsearch. Logstash collects data, aggregating logs and event data from a variety of potential sources, including AWS CloudWatch API and AWS S3 Buckets, and processes and enriches the data with out-of-the-box aggregation and mutations before forwarding it to Elasticsearch.
Kibana
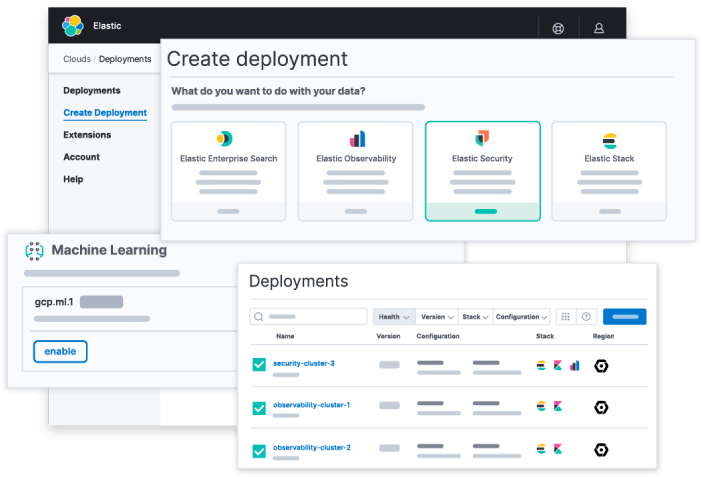
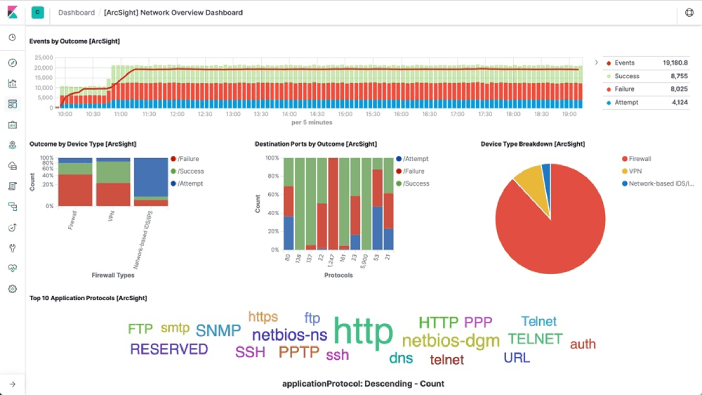
The final component in the ELK stack is Kibana, a data visualization tool that allows users to create histograms, charts, graphs, and other visual representations in real-time using data from Elasticsearch. Kibana is more than just a graphing tool however - it provides the visual interface that enables users to interact with the Elasticsearch database.
ELK Stack Use Cases
When deployed together, Elasticsearch, Logstash and Kibana work as a search and analytics engine, allowing IT operations teams to:
- Aggregate collected log data from a variety of sources using Logstash.
- Transform, process, and enrich log data using Logstash and Elasticsearch.
- Index and search log data using Elasticsearch.
- Explore and analyze log data, and produce data visualizations using Kibana.
Common use cases for the ELK stack include:
- Log Analysis and Monitoring: ELK is frequently used for centralizing and analyzing log data from various sources such as servers, applications, and network devices. It allows organizations to gain insights into system health, performance, and potential issues, helping to troubleshoot problems and maintain system reliability.
- Application Performance Monitoring (APM): With the Elastic APM module, the ELK Stack can be used to monitor the performance of applications. It enables developers and operations teams to track and analyze application behavior, identify bottlenecks, and optimize code performance.
- Security Monitoring: ELK can be utilized to monitor security events, collecting and analyzing security-related data from multiple sources to detect and respond to security threats, suspicious activities, and cyberattacks in real-time.
- Business Intelligence and Data Analytics: Organizations can use ELK to analyze large datasets, generate insights, and build interactive dashboards and visualizations for business intelligence purposes. This information helps in data-driven decision-making and identifying trends and patterns.
- Infrastructure Monitoring: Many teams use ELK for monitoring the performance and health of IT infrastructure, including servers, databases, networks, and cloud resources. It enables proactive monitoring and alerting based on predefined thresholds.
- DevOps Monitoring: For DevOps teams, ELK can be used to consolidate logs and metrics from various development and deployment tools, facilitating collaboration, and providing insights into the software development lifecycle.
- Compliance and Auditing: The ELK Stack can help organizations meet regulatory compliance requirements by collecting and retaining relevant data for audit trails and reporting, although retaining data in Elasticsearch can be costly (as we’ll cover later).
It’s important to note that the scale of cloud-native environments make ELK stack costs prohibitive. Let’s turn our attention to the pros and cons of depending on ELK for log analysis in cloud-based environments.
5 ELK Stack Pros and Cons
ELK Stack Pros
1. Free to Get Started
One of the key reasons for the growth in popularity of the ELK stack is its low financial barrier to entry. All of the software components of ELK are free and open-source tools - that means no up-front purchases are required and there are no ongoing software licensing fees.
2. Multiple Hosting Options
When it comes to deploying an ELK stack, organizations have multiple hosting options to choose from. For organizations with the right capabilities and resources, an ELK stack can be installed on a local server and managed in-house. Alternatively, organizations can choose to deploy their ELK stack as a managed service with products like Amazon OpenSearch by partnering with a specialist MSP.
3. Centralized Logging Capabilities
One of the most important features of the ELK stack is that it offers centralized logging capabilities, allowing users to aggregate logs from increasingly complex cloud environments into a single searchable index. This capability makes it possible to correlate log and event data from multiple sources, enabling use cases like security monitoring and root cause analysis.
4. Real-Time Data Analysis & Visualization
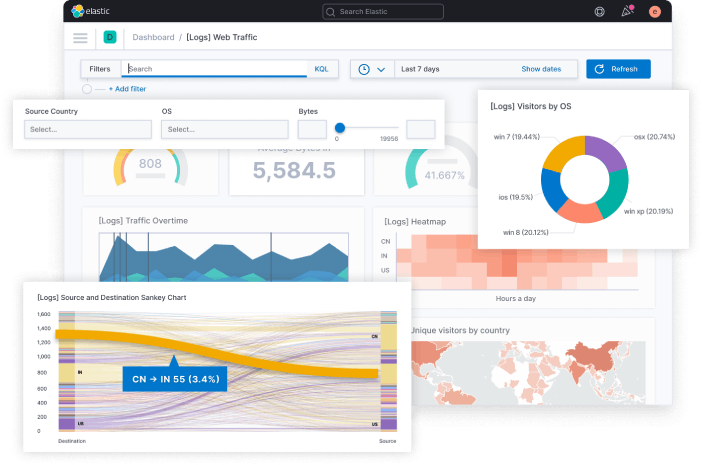
With Kibana, ELK stack users can create data visualizations and build custom dashboards using real-time data from Elasticsearch. The ability to visualize data in real time decreases time-to-insights, supporting a variety of use cases and driving organizational agility and informed decision-making. Installing Kibana is easy, and teams can build a Kibana dashboard using third party log analytics solutions that are more cost-effective and easy-to-use than Elasticsearch.
5. Official Clients in Multiple Programming Languages
Some ELK stack users have multiple languages in their codebase and wish to use Elasticsearch from all of them. To support this requirement, developers at Elastic have released official clients for Elasticsearch in at least 10 programming languages, including JavaScript, Go, Python, .NET, and Perl. In addition, the Elasticsearch open source community has contributed clients in various languages. Elastic provides support for all of its official clients, fixing bugs and responding to support queries as needed.
ELK Stack Cons
1. Complex Management Requirements
The ELK stack is free to download and receives thousands of downloads every month - but downloading the software is just the easy part. Deploying the stack is a multi-step process where users will need to:
- Configure log parsing and ingestion
- Build a data pipeline
- Monitor and handle exceptions to avoid data loss
- Configure replicas and sharding to optimize performance and avoid data loss
- Test logging configurations to ensure data consistency
- Implement security/application/network monitoring and alerting
Getting an ELK stack up and running is far from a straightforward process and organizations without the requisite skills and resources in-house will have to invest in a training program or recruit an ELK stack professional to manage the deployment.
2. High Cost of Ownership
ELK stack software is free to use, but building, growing, and maintaining the ELK stack requires infrastructure and resources. Whether you deploy on-premises or in the cloud, your costs for computing and data storage will depend on:
- The total log volume you aggregate daily from all applications, systems, and networks.
- How long you will retain data for either indexing or archiving.
On AWS, a daily log data ingest of 100GB/day with industry-standard ELK stack configuration and data retention best practices creates an annual hosting cost in the neighborhood of $180,000.
In addition to infrastructure costs that tend to grow over time, you’ll need at least one dedicated full-time employee to configure your ELK stack deployment, plus handle ongoing maintenance, patching, and customization as you scale. Factoring in Elasticsearch costs, it’s clear that “open-source” doesn’t necessarily mean “inexpensive”.
3. Stability & Uptime Issues
Users of the ELK stack have reported stability and uptime issues that seem to worsen as data volume grows.
Elasticsearch indices are a major cause of ELK stack instability. An index contains documents with log data that can be queried or analyzed by Elasticsearch. Users may define as many indices as needed, and there are no limitations on the size of documents or how many documents may be included in a given index. When the size of an index exceeds the data storage limitations of the node, indexing begins to fail and data loss or a crash can result.
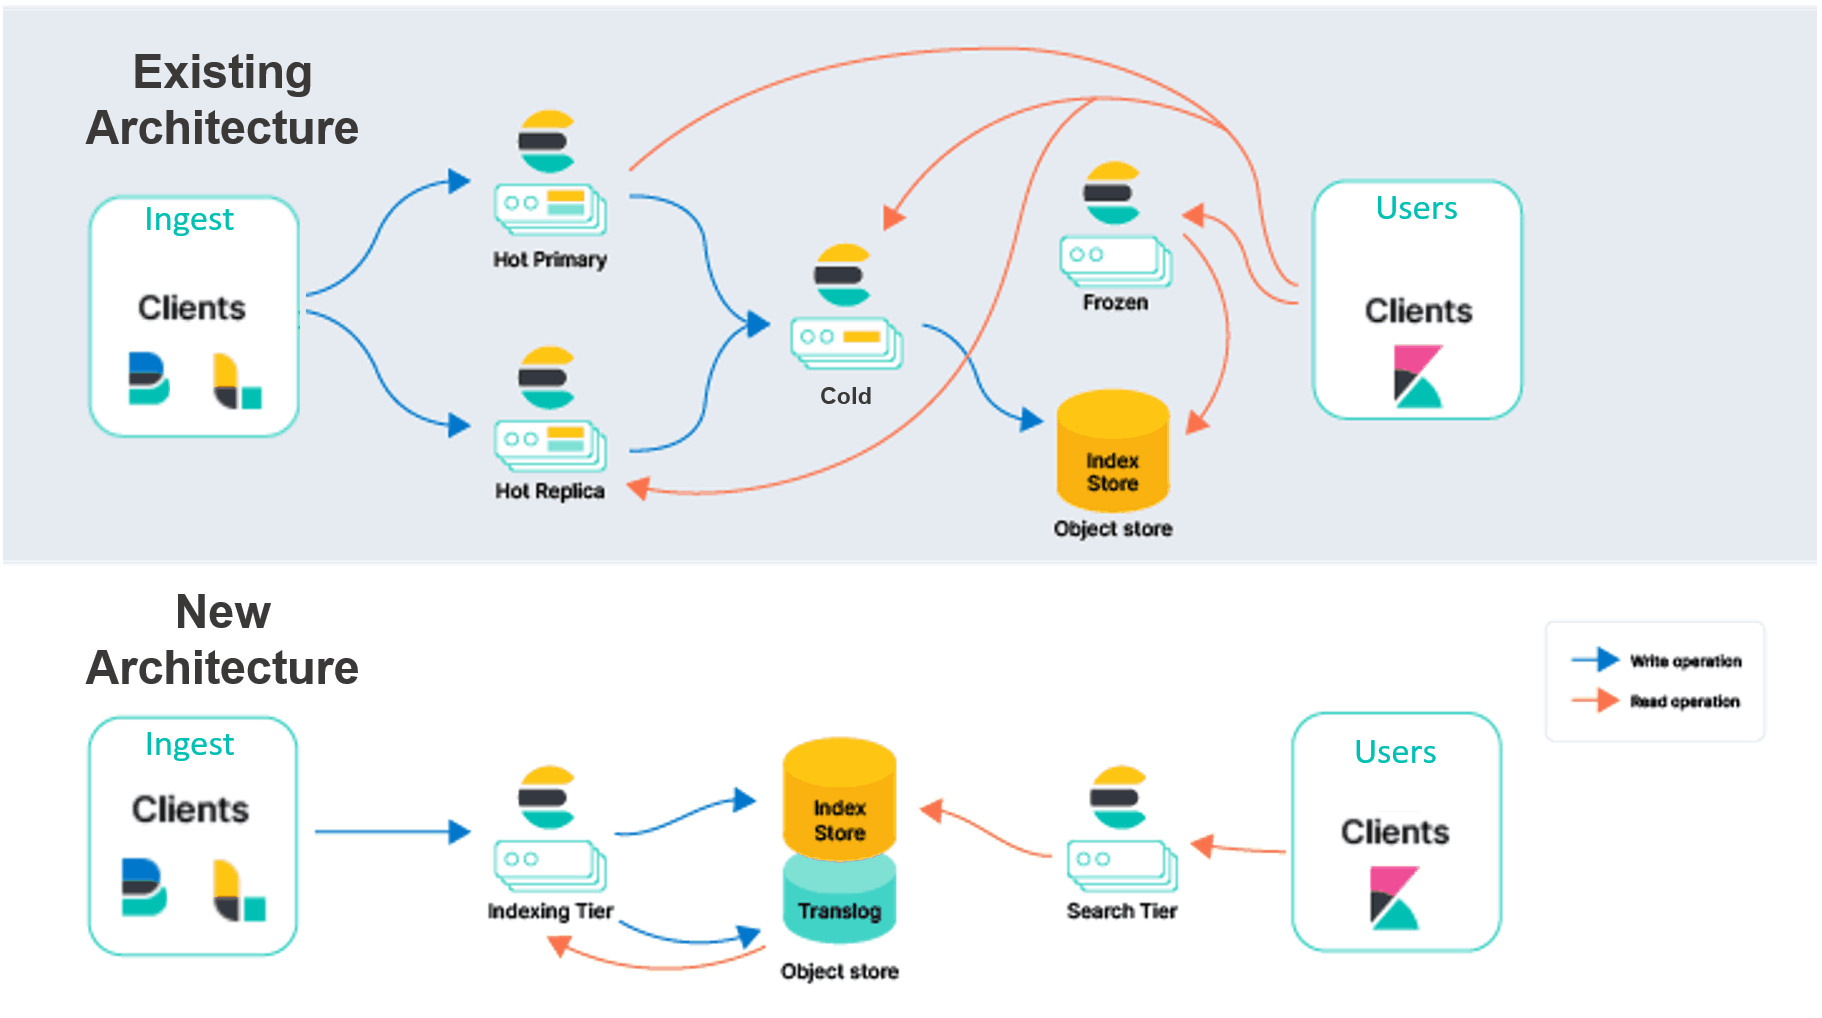
Elasticsearch is attempting to solve these problems through rearchitecting an serverless Elasticsearch offering, however underlying data representation and data architecture challenges still prevail. Organizations should seek out true serverless and stateless alternatives to avoid hidden complexity and added costs.
4. Data Retention Tradeoffs
As data volume grows, ELK stack users tend to encounter data usability challenges and trade-offs between data retention and cost. Maintaining longer data retention windows can enable teams to track longer-term trends in their data, as well as detect security issues such as advanced persistent threats (APTs). However, retaining data for longer isn’t always cost-effective in Elasticsearch. Let’s look at why many teams need to trade off retention for cost in ELK stack deployments.
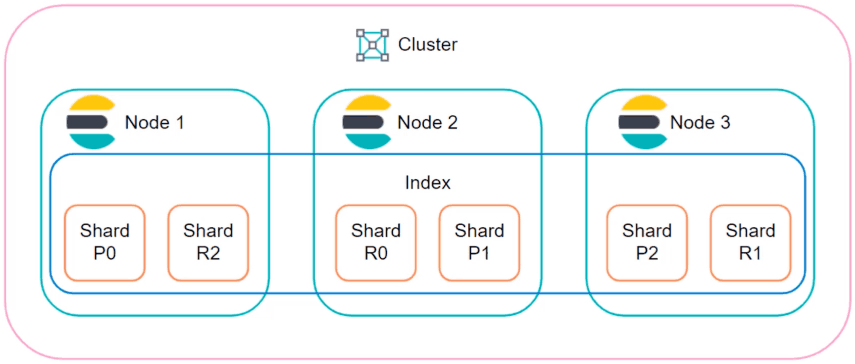
The reason has to do with two defining features of Elasticsearch: Sharding and Replicas.
Sharding allows users to split an index horizontally by breaking it into shards. Each shard is an independent Lucene index that can be queried by an Elasticsearch node, so users can parallelize operations across nodes and across shards to speed up operations. Replicas are copies of shards that serve as a back-up system. To protect against data loss in the event of a node failure, a replica and its identical shard will never be stored on the same node.
Sharding and replicas are both useful features, but leveraging them fully demands more compute resources, more disk space, and additional nodes. This leaves users to either swallow the costs or scale back on data retention and archiving to make up the difference.
5. Scaling Challenges
The ELK stack’s scaling challenges are a result of many issues we have already mentioned: the instability of large indices, the poor cost economics of sharing and replicas, and the rapid growth in TCO that manifests as organizations increase their daily ingestion of log files.
It’s not that ELK isn’t scalable, it’s more that the challenges and costs associated with scaling outweigh the benefits, especially when compared to ELK stack alternatives in the market today.
Want More from Your Log Analytics Solution? Swap Your ELK Stack for ChaosSearch
Organizations are turning to ChaosSearch for powerful log analytics in the cloud with unlimited data retention - and without the complexity and high TCO that comes with operating an ELK cluster.
ChaosSearch offers a new approach to indexing data in the cloud, one that deploys directly on cloud object storage and builds indices 60 times faster and 25 times smaller than Elasticsearch. The result is a serverless, stateless log analytics solution that’s simple to deploy, scales linearly into massive data volumes and outperforms the ELK stack for up to 80% lower cost.