
Operations | Monitoring | ITSM | DevOps | Cloud

The latest News and Information on Monitoring for Websites, Applications, APIs, Infrastructure, and other technologies.

How to Troubleshoot Slow Web Applications With Sematext

Maintaining a smooth operation of your web application is crucial for the success of your business. When customers encounter performance issues while using your application, it will likely affect your business reliability and customer satisfaction. This can lead to churn rate increase which will cause a loss of revenue. As a Site Reliability Engineer (SRE) or DevOps professional, you would want to keep your product reliable for end users.

Simplify Azure Monitoring with Logz.io's New Azure-Native Integration

If you’re looking to monitor Microsoft Azure infrastructure with Logz.io, we’re now making it easier than ever with our new Azure-native integration Typically, collecting infrastructure metrics from Azure involves installing and configuring data collection components on your system, such as Prometheus, Telegraph, or a number of proprietary agents that are specific to different vendors.

How to use the Grafana Faro Web SDK with Grafana Cloud Frontend Observability to gain additional app insights

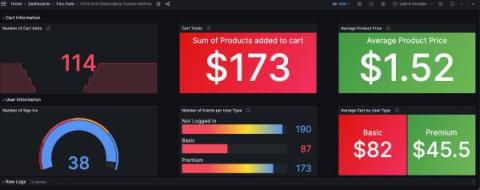
Frontend observability (or real user monitoring) is a critical, yet often overlooked, part of systems monitoring. Website and mobile app frontends are just as complex, if not more so, than the backend systems observability teams typically prioritize. They also represent the first interaction users have with our applications — so it’s important to have full visibility into that experience.

Leverage user context to debug mobile performance issues with the Instabug Datadog Marketplace offering

As user expectations for mobile apps increase, effective bug remediation involves not only addressing critical incidents as they occur but also proactively handling smaller performance issues in order to ensure a smooth user experience (UX). Instabug helps you understand how users experience your app with crucial mobile performance metrics—such as launch metrics, loading times, and UI hangs—viewable alongside your bug reports.

The Complementary Power of RUM & Internet Synthetic Monitoring

User expectations are at an all-time high, and any performance hiccups can lead to frustrated users and lost business opportunities. To get real-time insights into their digital assets and succeed in this competitive landscape, businesses need Internet Performance Monitoring (IPM) that incorporates both synthetic and Real User Monitoring (RUM). RUM and synthetics are two powerful tools that, when used in tandem, offer a comprehensive view of performance and user experience.

Troubleshooting Spring Boot Microservices - A Real World Case Study

Today, I’ll cover Shift Left Monitoring: A Pathway to Optimized Cloud Applications and how left-shifted troubleshooting of Spring Boot code issues using observability tooling can avoid production issues, unnecessary costs and improve product quality. Shift-left is an approach to software development and operations that emphasizes testing, monitoring, and automation earlier in the software development lifecycle.

Top 10 LogicMonitor Alternatives

In today's fast-paced digital world, businesses rely heavily on IT infrastructure monitoring tools to ensure optimal performance and reliability. LogicMonitor has carved a niche in the market as a comprehensive monitoring solution for complex IT environments. However, the recent security mishap has pushed us to look for other alternatives as well. Fairly recently, LogicMonitor was in hot waters for its weak default passwords, ultimately leaving them vulnerable to ransomware attacks.