


|
By Datadog
Well-designed service level objectives (SLOs) help you track the benchmarks your app needs to meet to deliver a successful user experience (UX). To track performance against these SLOs, many SRE teams are turning to real user monitoring (RUM) and synthetic monitoring for their service level indicators (SLIs), as these forms of data provide more direct measurements of UX than backend performance metrics.
|
By Datadog
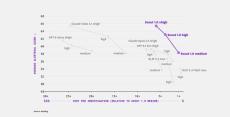
Today, we’re introducing Scout 1.0, Datadog’s first AI model specialized for investigating production issues. Scout powers Bits Investigation, our AI SRE. We trained Scout to reduce inference cost so that investigations are cheap enough to run an order of magnitude more often and earlier in an incident’s lifecycle. Key highlights include: Close dialog.
|
By Datadog
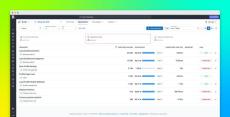
Frontend and mobile applications depend on technical steps that users expect to work in every user journey: loading search results, signing in, saving a payment method, or processing a payment. Datadog Real User Monitoring (RUM) captures detailed events about these interactions, including views, actions, resources, and errors. But examining those events individually does not always provide a direct answer to more fundamental questions: Did a critical application step work, and how long did it take?

|
By Datadog
Organizations are spending more on GPUs as they move AI workloads into production, and improving GPU utilization is a key priority. But Kubernetes’s legacy device plugin model can limit those improvements because it constrains how workloads request and consume GPU resources. Teams must configure GPU partitioning before workloads are scheduled. Resource requests cannot distinguish GPUs by capability, and a workload can reserve an entire GPU while using only part of its capacity.

|
By Datadog
Datadog runs thousands of internal services and has been increasing global footprint year after year. For most of that growth, we treated services uniformly when making deployment and reliability decisions. At our current scale, that approach became expensive. A change destined for production rolls out to data centers sequentially, so deployment time grows with every data center we add.
|
By Datadog
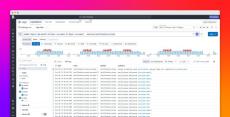
Organizations may need to keep data in specific regions or infrastructure they control, whether because of data residency requirements, internal policies, or transfer costs. Datadog Bring Your Own Cloud (BYOC) extends the Datadog platform into those environments. Each BYOC deployment runs as a Kubernetes cluster with its own object storage, keeping data close to its source.

|
By Datadog
Adding or renaming a product event has traditionally meant creating an engineering ticket. Datadog Product Analytics uses the same SDKs and configuration as Real User Monitoring (RUM), and those SDKs autocapture actions such as clicks and taps. But an automatically generated action name describes the element rather than the user intent behind it.

|
By Datadog
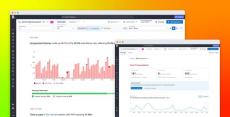
Earlier this year, Datadog for Government achieved FedRAMP High certification, extending our GovCloud environment (US1-FED) to the federal government’s most sensitive civilian workloads. That certification now covers Datadog Incident Response, bringing paging, incident coordination, automation, and postmortem workflows into US1-FED. When a government system goes down, responders need to reach the right people, coordinate a fix, and keep stakeholders informed.
|
By Datadog
AI-assisted development can increase the rate at which teams produce code, but teams only realize those velocity gains if CI can keep pace. More pull requests (PRs) mean more builds, tests, and pipeline executions. Slow jobs leave developers and coding agents waiting for feedback, flaky failures consume time in reruns and investigations, and unnecessary test execution increases runner demand as delivery volume grows.

|
By Datadog
Earlier in this series, we covered key metrics for monitoring performance in Databricks and discussed Databricks’ native resources for accessing those metrics and other key observability data, such as logs and data lineage. In this post, we’ll cover using the Databricks integration to bring that data into Datadog and monitor your Databricks analytics and AI/ML workloads alongside the rest of your end-to-end data pipelines and distributed infrastructure. We’ll show you how to.
|
By Datadog
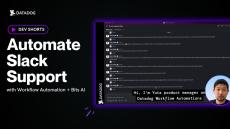
Automate Slack support questions with Datadog Workflow Automation and Bits AI Agent Builder. Datadog Workflow Automation can now trigger directly from messages posted in Slack. In this quick demo, Yuta Yoshida, Product Manager at Datadog, shows how to build an automated support workflow that: → Detects new support questions in a Slack channel→ Sends questions to a custom agent built with Bits AI Agent Builder→ Replies directly in the Slack thread with an answer and relevant documentation.
|
By Datadog
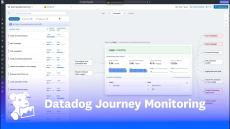
See how Datadog Journey Monitoring brings together user behavior, real-user insights, and proactive testing to track the health of critical user journeys, understand business impact, and quickly troubleshoot issues.

|
By Datadog
Modal is an AI infrastructure company rebuilding the cloud for AI, giving developers easy access to the compute needed to build and scale AI applications without managing the underlying complexity. Operating across more than 20 cloud providers and launching approximately 26 million containers daily, Modal relies on Datadog to unify observability across its infrastructure, applications, networking, and CI—helping its engineers detect 99% of incidents within five minutes, resolve 96% of issues before customer impact, and confidently scale one of the world’s most complex AI platforms.
|
By Datadog
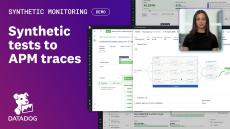
Engineering ships faster than ever with AI writing more of the code, but test coverage has to keep pace, or users find the broken flows first.
|
By Datadog
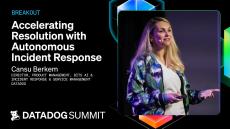
Incident response often spans a patchwork of tools, handoffs, and manual steps. An engineer gets paged, a team investigates the issue, the incident commander coordinates the response, SREs document decisions, and somebody (anybody!) writes the postmortem. Every handoff introduces more context switching, increasing the risk of critical information loss, and ultimately slowing resolution.
|
By Datadog
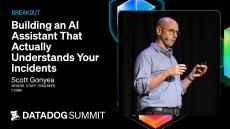
When production breaks, the clues are everywhere but the story is scattered. RUM sessions, APM traces, metrics, and logs allow Datadog to tell you part of the story. What’s missing is your service ownership quirks, your team's conventions, or the three-year-old workaround buried in a comment that explains why a certain endpoint behaves the way it does.
|
By Datadog
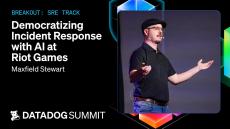
Senior engineers are the pillars of SRE programs—not only do they have the leadership to manage incidents well, they also have the tribal knowledge to understand the technical causes of tricky issues. But when the know-how is confined to a few individuals, it greatly limits the effectiveness of your SRE team.
|
By Datadog
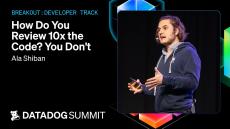
AI is generating code at 10x human speed, but we’re not shipping software 10x faster. Agents have a quality problem, and we still can’t trust their output without validation. Breaking the code review model didn’t help. So what would it take to autonomously ship code that’s actually trustworthy? Join us to explore what an agentic harness looks like when the SDLC is the harness, a validation system that spans intent, CI, staging, and production, with context flowing bidirectionally between all stages.
|
By Datadog
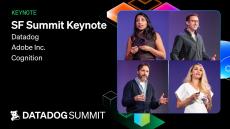
Datadog has always been driven by a broader vision of helping teams understand and operate complex systems. In this session, you'll hear from Michael Whetten, Senior Vice President of Product Management, and Cansu Berkem, Director of Product Management, as they share the latest updates across the Datadog product suite and discuss how that vision continues to shape the platform's evolution and support the next generation of AI-driven applications.
|
By Datadog
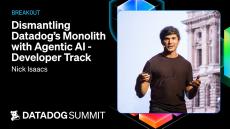
AI can write code, but how does it do with a large, organically built codebase with years of development? Datadog’s monolithic webapp had significant scale and support challenges, so we knew the time had come to break it up. But when the code has been written, revised and tweaked so many times (as we keep adding new features and capabilities), by so many teams, that becomes much harder.

|
By Datadog
The elasticity and nearly infinite scalability of the cloud have transformed IT infrastructure. Modern infrastructure is now made up of constantly changing, often short-lived VMs or containers. This has elevated the need for new methods and new tools for monitoring. In this eBook, we outline an effective framework for monitoring modern infrastructure and applications, however large or dynamic they may be.
|
By Datadog
As Docker adoption continues to rise, many organizations have turned to orchestration platforms like ECS and Kubernetes to manage large numbers of ephemeral containers. Thousands of companies use Datadog to monitor millions of containers, which enables us to identify trends in real-world orchestration usage. We're excited to share 8 key findings of our research.
|
By Datadog
Where does Docker adoption currently stand and how has it changed? With thousands of companies using Datadog to track their infrastructure, we can see software trends emerging in real time. We're excited to share what we can see about true Docker adoption.
|
By Datadog
Build an effective framework for monitoring AWS infrastructure and applications, however large or dynamic they may be. The elasticity and nearly infinite scalability of the AWS cloud have transformed IT infrastructure. Modern infrastructure is now made up of constantly changing, often short-lived components. This has elevated the need for new methods and new tools for monitoring.
|
By Datadog
Like a car, Elasticsearch was designed to allow you to get up and running quickly, without having to understand all of its inner workings. However, it's only a matter of time before you run into engine trouble here or there. This guide explains how to address five common Elasticsearch challenges.
|
By Datadog
Monitoring Kubernetes requires you to rethink your monitoring strategies, especially if you are used to monitoring traditional hosts such as VMs or physical machines. This guide prepares you to effectively approach Kubernetes monitoring in light of its significant operational differences.
- October 2026 (23)
- September 2026 (24)
- August 2026 (19)
- July 2026 (16)
- June 2026 (30)
- May 2026 (27)
- April 2026 (26)
- March 2026 (36)
- February 2026 (20)
- January 2026 (17)
- December 2025 (36)
- November 2025 (33)
- October 2025 (27)
- September 2025 (19)
- August 2025 (24)
- July 2025 (30)
- June 2025 (25)
- May 2025 (20)
- April 2025 (15)
- March 2025 (16)
- February 2025 (16)
- January 2025 (29)
- December 2024 (23)
- November 2024 (28)
- October 2024 (15)
- September 2024 (15)
- August 2024 (10)
- July 2024 (15)
- June 2024 (26)
- May 2024 (12)
- April 2024 (19)
- March 2024 (11)
- February 2024 (21)
- January 2024 (19)
- December 2023 (18)
- November 2023 (22)
- October 2023 (15)
- September 2023 (14)
- August 2023 (28)
- July 2023 (15)
- June 2023 (17)
- May 2023 (22)
- April 2023 (13)
- March 2023 (22)
- February 2023 (12)
- January 2023 (8)
- December 2022 (9)
- November 2022 (27)
- October 2022 (22)
- September 2022 (14)
- August 2022 (22)
- July 2022 (13)
- June 2022 (13)
- May 2022 (18)
- April 2022 (14)
- March 2022 (6)
- February 2022 (14)
- January 2022 (17)
- December 2021 (9)
- November 2021 (16)
- October 2021 (26)
- September 2021 (8)
- August 2021 (18)
- July 2021 (15)
- June 2021 (16)
- May 2021 (23)
- April 2021 (20)
- March 2021 (16)
- February 2021 (9)
- January 2021 (10)
- December 2020 (22)
- November 2020 (17)
- October 2020 (12)
- September 2020 (15)
- August 2020 (22)
- July 2020 (20)
- June 2020 (14)
- May 2020 (18)
- April 2020 (24)
- March 2020 (13)
- February 2020 (13)
- January 2020 (11)
- December 2019 (16)
- November 2019 (11)
- October 2019 (11)
- September 2019 (11)
- August 2019 (16)
- July 2019 (18)
- June 2019 (11)
- May 2019 (12)
- April 2019 (20)
- March 2019 (10)
- February 2019 (9)
- January 2019 (6)
- December 2018 (7)
- November 2018 (7)
- October 2018 (13)
- September 2018 (5)
- August 2018 (12)
- July 2018 (12)
- June 2018 (6)
- March 2018 (1)
- December 2017 (1)
- November 2017 (1)
- March 2015 (1)
Datadog is the essential monitoring platform for cloud applications. We bring together data from servers, containers, databases, and third-party services to make your stack entirely observable. These capabilities help DevOps teams avoid downtime, resolve performance issues, and ensure customers are getting the best user experience.
See it all in one place:
- See across systems, apps, and services: With turn-key integrations, Datadog seamlessly aggregates metrics and events across the full devops stack.
- Get full visibility into modern applications: Monitor, troubleshoot, and optimize application performance.
- Analyze and explore log data in context: Quickly search, filter, and analyze your logs for troubleshooting and open-ended exploration of your data.
- Build real-time interactive dashboards: More than summary dashboards, Datadog offers all high-resolution metrics and events for manipulation and graphing.
- Get alerted on critical issues: Datadog notifies you of performance problems, whether they affect a single host or a massive cluster.
Modern monitoring & analytics. See inside any stack, any app, at any scale, anywhere.