Operations | Monitoring | ITSM | DevOps | Cloud

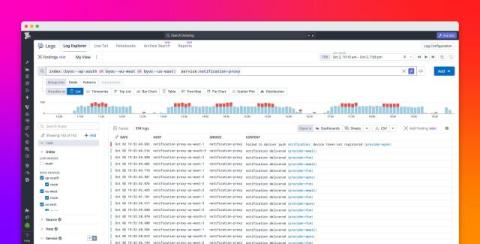
Data pipeline monitoring 101: Tracking health and performance across the data stack

Data pipelines are systems for moving and processing data. They are made up of concatenated services and data stores that programmatically ingest data from upstream sources; filter, transform, enrich, and route that data; and deliver it to downstream consumers.

Investigate account-level churn risk with Product Analytics account segments

An account can show signs of disengagement long before a renewal conversation begins. Users may stop returning to a core workflow, stall during onboarding, or skip a newly released feature. Product teams often see these signals only at the user level, while annual recurring revenue (ARR), plan, renewal date, and ownership data remain in a customer relationship management (CRM) system or data warehouse.

Instrument serverless apps with agentic onboarding

Serverless platforms like AWS Lambda, Google Cloud Run, and Azure Container Apps let teams run applications without managing infrastructure. However, getting full visibility into those workloads has traditionally required a lot of manual setup. A single team may deploy serverless applications across multiple clouds by using tools such as Terraform, AWS SAM, AWS CDK, and the Serverless Framework. Each of these platforms, runtimes, and deployment tools requires its own instrumentation steps.

Find, analyze, and collaborate on user sessions in Datadog Session Replay

Teams supporting user-facing applications rely on session replays to understand user friction. But resolving an issue or improving the user experience takes more than watching a replay. Engineers, product managers, and designers first need to find the right sessions to investigate, then quickly learn what happened at the key moments. Once they’ve investigated a replay, they need to share what they found across product, design, support, and engineering so that the right teams can act.

This Month in Datadog - July 2026

In July’s episode of This Month in Datadog, Ruxanda Lueck joins Jeremy for a conversation about how you can confidently evaluate and release features that contain AI-generated code. She also discusses her career trajectory from containers to AI, how agentic workflows impact trust during feature development, and the challenges of testing nondeterministic agent behavior.

Prioritize security findings with the Datadog Runtime Prioritization Engine

If you run a cloud security program, two questions follow almost every security finding: Who owns this? And how important is it? Many security tools answer those questions with static metadata such as owner tags, business criticality labels, and manually maintained inventories of critical assets, known as crown jewels. But cloud environments aren’t static. Teams reorganize, services change hands, and dependencies evolve.

A practical guide to React error monitoring

When designing effective error handling for React apps, the troubleshooting information you collect and display is critical. React errors can stem from a variety of causes, including user misconfiguration, backend and network issues, and mismatches in browser environments. Instrumenting your code to log critical context, including feature names, user data, and session activity, enables you to quickly identify where these errors originate.

Provision Datadog on Stripe Projects

Stripe Projects reduces the manual work of setting up, managing, and paying for third-party SaaS solutions. You can now use it to get started with Datadog in just two commands: If your Stripe account has a verified email address, running those commands in the Stripe CLI gives you a Datadog organization with a 14-day free trial and an automatically generated API key that is ready to use. You avoid email verification loops, tab-switching to copy an API key out of a dashboard, and lengthy sign-up forms.

AI gateway best practices: Model routing, reliability, and budget controls for production agents

Organizations are increasingly using multiple models to build AI agents in order to find the best balance of performance and cost for each agentic task and LLM call. As we discovered in the 2026 State of AI Engineering report, there isn’t currently a clear winner in terms of adoption among competing models and many organizations are keeping older models in flight despite frequent new releases.

From zero to traces: Choosing the right APM instrumentation method for your stack

Instrumenting a tech stack for distributed tracing is a complicated process that often takes weeks. For large fleets running services written in multiple languages, the timeline could be months. Every service needs a tracing library added, configured, and redeployed, and that work has to fit into each team’s release schedule. Datadog’s Single Step Instrumentation (SSI) cuts the time it takes to instrument your applications to send traces to Datadog APM down to minutes.