Operations | Monitoring | ITSM | DevOps | Cloud

The latest News and Information on Monitoring for Websites, Applications, APIs, Infrastructure, and other technologies.

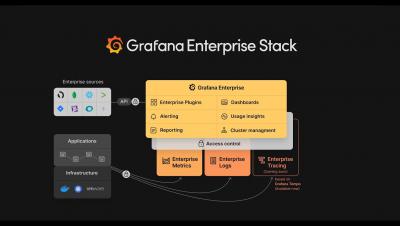
The Grafana Enterprise Stack in less than 3 minutes

Grafana Labs is the open & composable observability company. In just over 6 years, our namesake product, Grafana, has become the world's #1 dashboarding service for time series data with over 6 million users. And we've been recognized as a leader in the space. Grafana Labs has built the world's first open & composable observability stack -- and it's natively designed for monitoring hybrid-cloud, container, and microservices environments.


What is the Coralogix Security Traffic Analyzer (STA), and Why Do I Need It?

The wide-spread adoption of cloud infrastructure has proven to be highly beneficial, but has also introduced new challenges and added costs – especially when it comes to security. As organizations migrate to the cloud, they relinquish access to their servers and all information that flows between them and the outside world. This data is fundamental to both security and observability.

Lambda Extensions Just Got Even Better

AWS announced AWS Lambda Extensions back in October 2020 and I wrote extensively about it at the time – what it is, how it works, and why you should care. In short, Lambda Extensions allow operational tools to integrate with your Lambda functions and run either in-process alongside your code or in a separate process. To better understand the problems they solve and their use cases, please read my previous article.

What is the best way to profile a Java application in eclipse

Java profiling in Eclipse allows you to optimize your code, streamline your application, and better understand your program. When profiling your application using a line-level analysis, you can reveal the slowest line within a sluggish piece of code, helping you efficiently troubleshoot problems. There are a variety of platforms for profiling Java eclipse. Eclipse is a popular software and is especially valuable for beginners due to its clean interface and free and open-source background.

ServiceNow acquires next-gen observability leader Lightstep

I’m excited to announce that ServiceNow has signed an agreement to acquire next-generation observability leader Lightstep. Combining Lightstep’s innovative observability capabilities with ServiceNow’s unmatched Now Platform will help customers better manage software complexity, reliability, and performance while enabling the enterprise workflows that deliver great experiences.

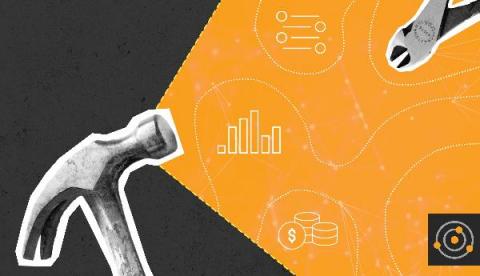
Better Tools = Better Monitoring

Everyone loves tools. Whether you’re a weekend craftsman, an aspiring chef, or a serious IT professional, the tools you use can make your tasks much easier. Monitoring tools in IT are mainstays when it comes to keeping an eye on network infrastructure and enforcing company security policies. But just like anything in life, not all monitoring tools are built equally—in fact, many can harm your ability to respond to emerging issues within your network.

Best practices for modern frontend monitoring

Single-page applications (SPAs) provide some significant benefits over multiple-page apps. For JavaScript developers using frameworks like React or Vue, they offer flexibility in moving application logic to the frontend, reducing the need for complex backend operations. For users, SPAs can provide a smooth experience with a highly interactive UI and fewer page loads. But, with increased sophistication, there are some tradeoffs.

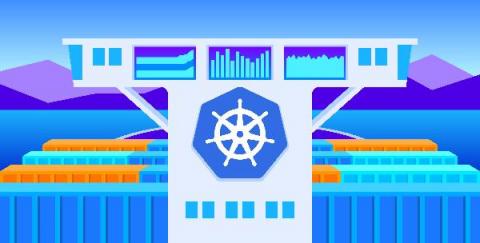
Monitor kube-state-metrics v2.0 with Datadog

In order to manage complex containerized applications, modern devops teams need to have deep visibility into the status of their Kubernetes resources. By listening directly to the Kubernetes API, the open source kube-state-metrics service generates key metrics about your Kubernetes objects, including pods, nodes, and deployments, which are essential for understanding the status and performance of your clusters.