Operations | Monitoring | ITSM | DevOps | Cloud

February 2022

Ask Miss O11y: OpenTelemetry in the Front End: Tracing Across Page Load

Ah, good question! TL;DR: store the start time of the span, and then create the span on the new page. Usually, you want to start a span, do some work, and then end the span. The whole span gets sent to your OpenTelemetry collector (and thence to Honeycomb) when you end it. But when a page load happens, that span object is lost. Honeycomb never hears about it becausespan.end()wasn’t called. How can we deal with this? Create the span only on the new page, where you can end it. But!

The Truth About "MEH-TRICS"

A long time ago, in a galaxy far, far away, I said a lot of inflammatory things about metrics. “Metrics are shit salad.” “Metrics are simply nerfed dimensions.” “Metrics suck,” “metrics are legacy,” “metrics and time series aggregates will fucking kneecap you.” I cannot tell a lie; Twitter will testify that I’ve spent the past six years ragging on metrics.

Ask Miss O11y: Making Sense of OpenTelemetry-Context

“What is up with the Context in OpenTelemetry? Why do I need to mess with it at all? Why, when I set a span as active, don’t subsequent spans just use it as a parent?” Oh, yikes, yeah. The Context abstraction in OpenTelemetry is hard to understand. Here are several ways it’s tricky.

How We Define SRE Work

At the time of writing this post, I have officially been at Honeycomb for one year as a site reliability engineer (SRE). I had shared my initial experiences and impressions in this post and thought it would make sense to check back in now that I’ve had the opportunity to spend time learning about the team, the culture, and the code base more in depth.

ICYMI: Achieving Visibility in Your CI/CD Pipeline With Honeycomb + CircleCI

Before continuous integration came to be, setting up builds was no fun because the complexity and overhead involved in a release cycle was compounded by inflexible, manual processes. The release cycle was slow and often resulted in breaking changes. Continuous integration and continuous delivery (CI/CD) has changed much of that through pipelines that automate how we build and test software—today, we can deploy, have builds fail, and resolve any errors faster than ever.

Ask Miss O11y: Making Sense of OpenTelemetry-Tracer and TracerProvider

OpenTelemetry is a strong standard for instrumentation because it is built of careful, well-thought-out abstractions created by experts in the space. OpenTelemetry feels painful to start using because it’s full of abstractions that make sense to experts in the space. For a developer who wants to think about their own software and not spend a month becoming an expert in telemetry, this is hard. For high-level conceptual description, there’s the OpenTelemetry specification.

Share Progress and Celebrate Wins With Demo Days

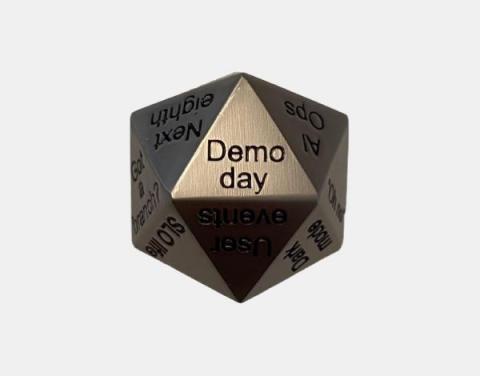
In my last blog post, I talked about the cadence of product planning and delivery at Honeycomb. Tucked away in there was a mention of “demo day”—and I’m back to tell you all about that because it’s a pretty big deal around here, and I want to encourage you to give it a try as a way to see progress on new feature development and get folks excited about what’s on the horizon.

Ask Miss O11y: Observability vs BI Tools & Data Warehouses

Yes! While data is data (and tools exist on a continuum, and can and often are reused or repurposed to answer questions outside their natural domain), observability and BI/data warehouses typically exist on opposite ends of the spectrum in terms of time, speed, and accuracy, among others.

Tapping Into the Hive Mind: Sharing Query History

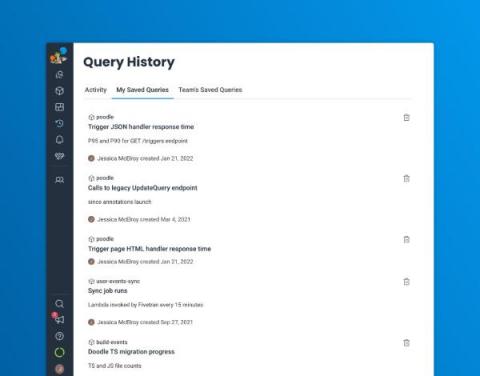
Ever wonder how your teammates go about debugging? When you use Honeycomb, you’re not only getting observability into your systems; it also provides observability into how your teammates use Honeycomb! Very meta, no? You’re never alone when writing or running Honeycomb queries. Opening up the right sidebar will show you the queries your teammates have recently run on the same dataset.