Operations | Monitoring | ITSM | DevOps | Cloud

July 2019

Introducing Breadcrumbs

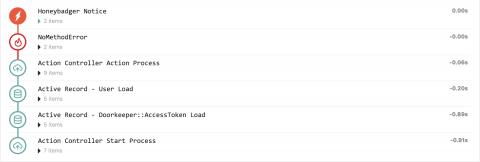
Have you ever dealt with an error in production, and no matter what you try, you can't replicate the issue on your development or staging environments? Often the next step is to gather more data by tossing a debug log at production. If you don't have a good way to correlate logs with a request it can be frustrating, especially during an incident. We added a feature to help, and it's called Breadcrumbs.

How We Migrated To Turbolinks Without Breaking Javascript

It's 2019, so we decided it was time to take a more modern approach to the Honeybadger front end. We implemented Turbolinks! This is only the first step on an ambitious roadmap. In 2025 we plan to migrate to Angular 1, and we'll finish out the decade on React unless we run into any roadblocks! But let's get real. Honeybadger isn't a single page app, and it probably won't ever be. SPAs just don't make sense for our technical requirements.

How To Track Timeouts In Honeybadger

The other day a long-time customer wrote in with a problem. They use Honeybadger to monitor their Ruby apps for exceptions but were having trouble catching timeouts. If their app took too long to respond, their application server, Puma, would abort the request. The only insight their team had into this problem was through Puma's logs. Most people consider timeouts to be a kind of error, so it'd be nice to have them reported by Honeybadger like any other errors.