Operations | Monitoring | ITSM | DevOps | Cloud

September 2022

Understanding Domain-Agnostic v. Domain-Centric AIOps Platforms

No matter what we do, we’ll always be surrounded by choices. Do I save money and take the bus, or do I spend money filling up my gas tank? Do I make dinner at home, or do I eat dinner out? Whatever the outcome, it’s our needs – what we require and what we can afford – that help guide us to where we should go. Technology is no exception. Especially in AIOps.

The Complex But Elegant Relationship Between AIOps and Observability

Digital transformation requires organizational evolution. Constant demand for rapid delivery of upgrades and new products forces change. Surely, the old days of managing monolithic applications housed in private servers are over. Applications consist of virtualized, containerized, and serverless code that’s networked via APIs across a hybrid infrastructure of public and private clouds.

Part 6: Observability Maturity Model Summary

For decades, IT operations teams have relied on monitoring for insight into the availability and performance of their systems. But the shift to more advanced IT technologies and practices is driving the need for more than monitoring – and so observability evolved. With infrastructures and applications that span multiple dynamic, distributed and modular IT environments, organizations need a deeper, more precise understanding of everything that happens within these systems.

Understanding the Observability Maturity Model

Based on research and conversations with enterprises from various industries, StackState created the Observability Maturity Model. This model defines the four stages of observability maturity. The ultimate destination is level four, Proactive Observability with AIOps. However, even moving from level one to two, or from level two to three, is a huge improvement in your ability to get essential insights into your IT environment.

Part 5: Proactive Observability With AIOps- Level 4

Level 4, Proactive Observability With AIOps, is the most advanced level of observability. At this stage, artificial intelligence for IT operations (AIOps) is added to the mix. AIOps, in the context of monitoring and observability, is about applying AI and machine learning (ML) to sort through mountains of data looking for patterns.

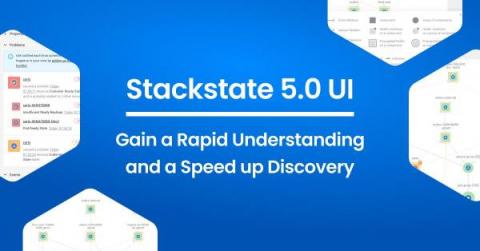
StackState 5.0 UI; Gain a Rapid Understanding and a Speed up Discovery

Do you experience this: Your brain seems to explode because there is so much you try to fit into ”working” memory? It can happen on a Friday afternoon, after a busy work week. Or on a Monday, looking at your calendar while figuring out how to fit in all those meetings and still get real work done.

Part 4: Causal Observability - Level 3

It’s not surprising that most failures are caused by a change somewhere in a system, such as a new code deployment, configuration change, auto-scaling activity or auto-healing event. As you investigate the root cause of an incident, the best place to start is to find what changed. To understand what change caused a problem and what effects propagated across your stack, you need to be able to see how the relationships between stack components have changed over time.

AIOps for Real: Characteristics of a Platform That Add Value and Drive Change

When you’re investing in automation solutions, ultimately, tangible results need to follow quickly. Getting a return on investment (ROI) out of an automation project after two years is something that would have been OK in the not-so-distant past but is no longer acceptable nowadays. With the current speed of change, where new technologies come and go and existing ones evolve at lightning speed, IT teams require much faster time to value on automation investments.

Part 2: Monitoring - Level 1

The first level of the Observability Maturity Model, Monitoring, is not new to IT. But as reliable IT system operation becomes more and more critical, the importance of monitoring continues to increase. A monitor tracks a specific parameter of an individual component in the system to make sure it stays within an acceptable range; if the value moves out of the range, the monitor triggers an action, such as an alert, state change or warning.

Using Observability with Kubernetes to Automate Site Reliability Engineering

In this video, Anthony Evans, solution architect, explains how the StackState topology-powered observability platform can help SREs to automate site reliability, putting their organizations on the path to becoming a zero-downtime enterprise. See how StackState helps to unify and correlate data across your stack, visualize your entire IT environment, instantly pinpoint root cause, reduce alert storms and with AIOps capabilities, even prevent problems proactively. It's all here!

Changes are Observability's Biggest Blind Spot

Classically, the space of observability lies within layers of information on a dashboard. It operates by using the fundamental trio of data — metrics, logs and traces — from each layer of the environment to assess the health of an IT infrastructure. However, a time component is critical, making the stack observable at any point in time. Gathering reliable data and insights into your IT infrastructure remains the primary role of observability tools and services.

Real World Insights - My Take on the Observability Maturity Model

A prelude to our upcoming six-part Observability Maturity Model Fundamentals blog series. By Lodewijk Bogaards At StackState, we have spent eight years in the monitoring and observability spaces. During this time, we have spoken with countless DevOps engineers, architects, SREs, heads of IT operations and CTOs, and we have heard the same struggles over and over.