Operations | Monitoring | ITSM | DevOps | Cloud

October 2022

Understanding the Three Pillars of Observability: Logs, Metrics and Traces

Many people wonder what the difference is between monitoring vs. observability. While monitoring is simply watching a system, observability means truly understanding a system’s state. DevOps teams leverage observability to debug their applications, or troubleshoot the root cause of system issues. Peak visibility is achieved by analyzing the three pillars of observability: Logs, metrics and traces.

Eliminate Data Transfer Fees from Your AWS Log Costs

As businesses generate, capture, and seek to analyze more data than ever before, they often find themselves limited by high data storage costs, expensive data processing fees, and high management overhead. For organizations who wish to expand their log analytics programs and become more data-driven, maximizing cost efficiency has become a critical operational objective.

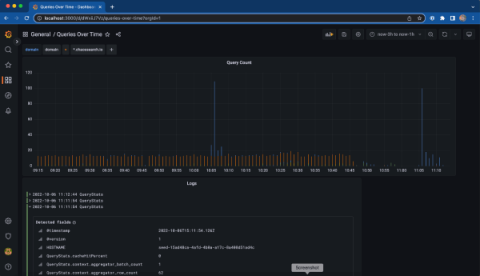
Tutorial: How to Use ChaosSearch with Grafana for Observability

In my last blog post, Building a Cost-Effective Full Observability Solution Around Open APIs and CNCF Projects, we introduced using ChaosSearch in combination with the most popular open source front- and back-ends in the application observability space. In case you missed it, the TL;DR version is that you can use a variety of open source projects and open API-based components to build the best-of-breed observability stack of your choice rather than relying on expensive, all-in-one solutions.