Operations | Monitoring | ITSM | DevOps | Cloud
August 2019
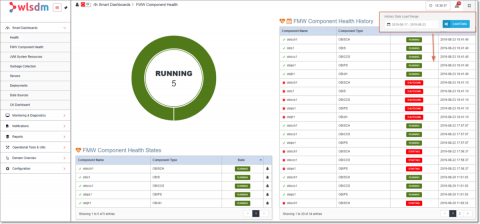
How to Get WebLogic Assets Health State?
To get to the health state of a deployment, you can use the following code after connecting to the Adminserver over WLST
How to Compare JVM Arguments of WebLogic ManagedServers in WL-OPC ?
Node Manager can start a server without requiring you to specify startup options. However, if you have modified your environment; for example, if you have added classes to the WebLogic Server classpath, you must specify startup options before you use the Administration Console to start a server.
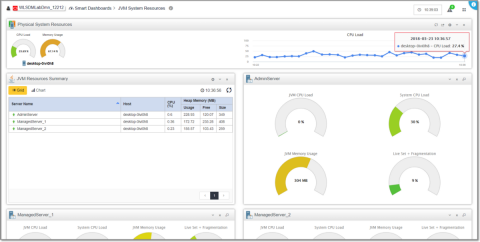
How to Check Memory Usage in WebLogic Console and Monitoring WebLogic JVM Heap and CPU Usage in WLSDM
Weak JVM performance affects WebLogic domain performance directly. That’s why the host’s CPU and memory usage is very important in terms of improving WebLogic performance. Higher CPU consumption and Garbage Collection duration can cause applications to run slowly, even cause the WebLogic servers facing downtime. JVM instances in a WebLogic need to be monitored constantly and notification/alarm infrastructure must be installed as well.
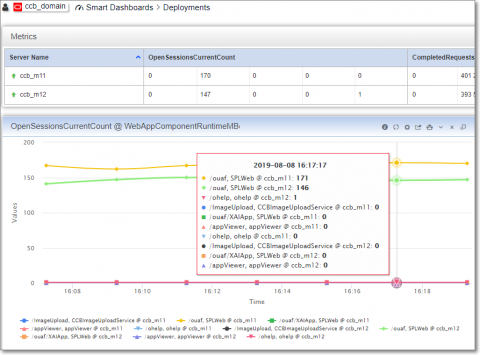
How to Monitor Active Sessions in WebLogic Server
Navigate as below for WebLogic active sessions monitoring.
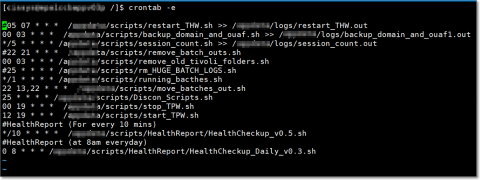
Using Cron Jobs and How to Create Schedule Job in WLSDM
Cron allows Linux and Unix users to run commands or scripts at a given date and time. You can schedule scripts to be executed periodically. The cron service runs in the background and constantly checks the /etc/crontab file, and /etc/cron.*/ directories. You can add new crontab defination using with “crontab -e” and list all jobs with “crontab -l”.


