


|
By Sangavi Dass
Every IT incident response starts the same way. Something breaks, an alert fires, and someone has to act on it. The faster that chain completes, the better your team looks on the SLA reports and the less your users feel it. If you're using HaloITSM, a service desk platform built for enterprise IT operations, that chain now has one fewer link.

|
By Bela Susan Thomas
A marathon runner who trains obsessively on a flat track will have beautiful split times right up until race day when they discover the actual course has hills. Although the preparation was real, their strategy was flawed. This plays out in SLO teams more than anyone likes to admit. At first, numbers look fine and nothing has been triggered. Then, a support ticket comes in showing checkout has been down for 20 minutes. The SLO wasn't broken.

|
By Bela Susan Thomas
Every growing business hits a moment of truth somewhere between "we just launched" and "we just lost a customer because our site was down for 40 minutes." It's then that you realize the free monitoring tool you set up six months ago—the one that felt more than adequate at the time—is no longer pulling its weight.

|
By Aravind Khanna
When an incident hits at 2am, every second of context switching adds risk. The latest StatusIQ iOS update is built around one principle: Get the right information and the right actions to your team faster, with less friction. With iOS 27 support now live in the StatusIQ mobile app, here's what's changed and why it matters.

|
By Bela Susan Thomas
A peak sale season, missed transaction or availability issues, spiking customer tickets, and unhappy customers. Well, you know the trope. A few years ago, this was just part of doing business online. Today, it’s a problem you can avoid, thanks to artificial intelligence. We’ve quietly reached an important turning point in website monitoring. For most of the internet’s history, monitoring meant setting thresholds: set a number, wait for it to be crossed, get an alert, and fix the issue.

|
By Sri Varalakshmi
Long before dashboards and decibel-loud alerts, there were watchtowers. Every kingdom worth its salt had them, men perched on hills, lighting fires to signal the moment they spotted something suspicious on the horizon. It was, in its time, a fine system. The trouble was that watchmen, being human, occasionally mistook a herd of cattle for an invading army, or a dust storm for smoke, and lit their fires anyway.
|
By Sangavi Dass
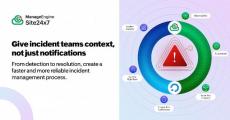
Your payment API suddenly returns 503 errors. Within seconds, your infrastructure monitors, application checks, and dependency monitors begin generating their own alerts. And while the dashboards keep flashing, the clock is still running. Your customers are waiting, internal teams are asking for updates, and engineers are trying to separate the real problem from the noise before the situation gets worse.

|
By Bela Susan Thomas
Without Border Gateway Protocol (BGP) monitoring, your digital experience monitoring (DEM) stack can't detect the route hijacks, leaks, or instability that prevent users from reaching your applications. Most DEM stacks miss this entirely, and that gap is where some of the most damaging, hardest-to-diagnose outages happen.

|
By Sangavi Dass
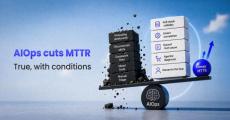
One night, Daniel Rizzy was the only person awake on Zylker’s IT team, and the clock was already running. He was also the only thing standing between a P1 outage and 10,000 customers. Rizzy works nights for ZylkerXchange, Zylker’s foreign currency exchange app. He lives on the city’s outskirts, where the air is clean and quiet, and the night shift suited that life. Most nights, nothing happened. Some nights, everything did.
|
By Sangavi Dass
There was a version of daily life, not long ago, that ran entirely on physical effort. Booking a trip meant a visit to a travel agent. Ordering lunch meant walking to a restaurant or calling and hoping someone picked up. Buying something for the home meant a trip to the store and a checkout queue. Paying a bill meant visiting a bank branch and engaging with a teller. None of it was instant, and nobody expected it to be.
Learn how to set up and monitor Business Transactions using Site24x7's APM Insight in this step-by-step tutorial. We walk through configuring APM Business Transaction Rules, defining transaction criteria (like HTTP method and URL patterns), and analyzing key performance metrics such as response time, throughput, Apdex score, request count, and exception rate. Whether you're troubleshooting slow application performance or setting up proactive monitoring for your business-critical transactions, this video shows you exactly how to get actionable insights from your APM dashboard.
This session covers everything you need to know about infrastructure monitoring, starting from agent-based server monitoring to database monitoring, container monitoring (Docker & Kubernetes), multi-cloud monitoring (AWS, Azure, GCP, OCI), IT automation, custom plugins, and ManageEngine CloudSpend for cloud cost management. If you're looking to master full-stack infrastructure observability, this hands-on walkthrough shows you exactly how to set up and use each Site24x7 module inside the live console.
Running Kubernetes on Red Hat OpenShift adds powerful enterprise capabilities—but also introduces operator-driven workloads, stricter RBAC and SCC policies, and platform-specific complexity. In this video, learn how Site24x7 enables platform-aware monitoring for OpenShift environments, helping DevOps and platform teams gain complete visibility without blind spots.
Learn how to monitor and troubleshoot Business Transactions using Site24x7's APM Insight in this step-by-step walkthrough. In this video, you'll see how to: Set up Business Transaction grouping rules based on URL patterns Track key performance metrics — response time, throughput, Apdex score, and error rate Drill down into individual transaction traces to pinpoint slow requests Use trend graphs to spot performance regressions over time Identify the exact business-critical workflows impacting your application's user experience.

A green uptime check only proves the server responded, not that customers can actually log in, search, and pay. Synthetic transaction monitoring runs your critical user journeys 24/7 from real locations and alerts your team the moment a flow breaks. Catch it before your customers do.
Running Kubernetes on Red Hat OpenShift adds powerful enterprise capabilities—but also introduces operator-driven workloads, stricter RBAC and SCC policies, and platform-specific complexity. In this video, learn how Site24x7 enables platform-aware monitoring for OpenShift environments, helping DevOps and platform teams gain complete visibility without blind spots.
Learn how to use the Cost Allocation report in ManageEngine CloudSpend to accurately split, track, and attribute your multi-cloud spend across AWS, Azure, and GCP. This step-by-step tutorial shows you how to create a cost allocation, choose accounts, apply labels, configure allocation levels, and read the hierarchical allocation report by cloud, account, and region. Cost allocation is the foundation of FinOps. It tells you exactly which teams, projects, and cost centers are driving your cloud bill so you can charge back, budget, and optimize with confidence.
In this video, you'll learn how to integrate Large Language Models (LLMs) with Site24x7 using Bring Your Own Key (BYOK), Zoho Key Services (ZKS), and Microsoft Azure OpenAI. Discover how Zia helps you analyze outages, understand performance issues, identify root causes, and get monitoring insights using simple natural-language queries. What you'll learn.
Welcome to Day 1 of the Site24x7 Training Program! This is the first session in our 5-part training series covering every module of Site24x7. In this session, we introduce the platform and take a deep dive into: Website Monitoring Real User Monitoring (RUM) Digital Risk Analyser (DRA) Session 1 – Introduction & Website Monitoring, Real User Monitoring, Digital Risk Analyser.
Managing dozens of client environments you don't own, behind firewalls you can't see through, while keeping SLAs intact is the essential MSP predicament. Site24x7 MSP is a cloud-native platform built to solve it. From a single multi-tenant console, monitor servers, networks, applications, and cloud workloads across AWS, Azure, and GCP with agent-based telemetry that catches issues before they escalate. True data isolation and RBAC keep client accounts secure. White-labeled portals, domains, and agents make it look like your platform. AI-powered self-healing workflows resolve incidents automatically.

|
By Site24x7
The number of companies using internet as their business platform has increased at an exponential rate in the past decade.
|
By Site24x7
In today's connected society, the demands placed on data center professionals is at an all-time high due to the need for modern devices to always have connectivity.
|
By Site24x7
Site24x7 combines web performance monitoring from a user perspective, key performance indicators across infrastructure, and deep app code visibility, making life for IT Operations teams easier!
|
By Site24x7
The whitepaper discusses the need to measure end-user experience from a global perspective and how Site24x7 can help organizations achieve optimal level of quality end-user experience.
|
By Site24x7
Understand how your DevOps team can benefit by using an application performance monitoring tool.
- September 2026 (4)
- August 2026 (7)
- July 2026 (8)
- June 2026 (4)
- April 2026 (3)
- March 2026 (4)
- February 2026 (13)
- January 2026 (3)
- December 2025 (20)
- November 2025 (11)
- October 2025 (13)
- September 2025 (8)
- August 2025 (5)
- July 2025 (7)
- June 2025 (9)
- May 2025 (6)
- April 2025 (15)
- March 2025 (26)
- February 2025 (40)
- January 2025 (28)
- December 2024 (26)
- November 2024 (13)
- October 2024 (13)
- September 2024 (8)
- August 2024 (18)
- July 2024 (14)
- June 2024 (12)
- May 2024 (9)
- April 2024 (17)
- March 2024 (17)
- February 2024 (14)
- January 2024 (5)
- December 2023 (3)
- November 2023 (8)
- October 2023 (3)
- September 2023 (2)
- August 2023 (8)
- July 2023 (7)
- June 2023 (8)
- May 2023 (3)
- April 2023 (4)
- March 2023 (3)
- February 2023 (2)
- January 2023 (2)
- December 2022 (1)
- November 2022 (4)
- October 2022 (4)
- August 2022 (1)
- July 2022 (4)
- June 2022 (6)
- May 2022 (5)
- April 2022 (5)
- March 2022 (4)
- February 2022 (2)
- January 2022 (6)
- December 2021 (2)
- November 2021 (2)
- October 2021 (1)
- September 2021 (3)
- August 2021 (3)
- July 2021 (2)
- April 2021 (7)
- March 2021 (6)
- February 2021 (6)
- January 2021 (5)
- December 2020 (2)
- November 2020 (2)
- October 2020 (6)
- September 2020 (6)
- August 2020 (13)
- July 2020 (16)
- June 2020 (9)
- May 2020 (10)
- April 2020 (10)
- March 2020 (12)
- February 2020 (5)
- January 2020 (6)
- December 2019 (4)
- November 2019 (1)
- September 2019 (1)
- June 2019 (1)
- March 2019 (1)
- December 2018 (1)
- November 2018 (2)
- October 2018 (2)
- September 2018 (2)
- August 2018 (2)
- July 2018 (1)
- April 2018 (3)
- March 2018 (1)
- February 2018 (3)
- January 2018 (2)
- December 2017 (4)
- November 2017 (1)
- October 2017 (1)
- July 2017 (1)
- November 2016 (1)
- October 2016 (1)
- September 2016 (2)
- August 2016 (1)
- January 2016 (1)
- December 2015 (3)
- November 2015 (2)
- October 2015 (2)
- December 2014 (1)
- May 2014 (2)
- April 2013 (1)
- April 2012 (1)
Site24x7 offers unified cloud monitoring for DevOps and IT operations with monitoring capabilities extending to analyzing the experience of real users accessing websites and applications from desktop and mobile devices.
All-in-One Monitoring Solution:
- Monitor Website Performance: Monitor the performance of internet services like HTTPS, DNS Server, FTP Server, SSL/TLS Certificate, SMTP Server, POP Server, URLs, REST APIs, SOAP Web Service, and more from 90+ global locations (or via wireless carriers) and those within a private network.
- Server Monitoring: Stay on top of outages and pinpoint server issues with root cause analysis capabilities. Create custom plugins and monitor critical attributes. Monitor Windows, Linux, FreeBSD, VMware and Docker.
- Synthetic Web Transaction Monitoring: Record and simulate multi-step user interactions in a real browser and optimize login forms, shopping carts and other applications.
- Application Performance Monitoring for DevOps: Identify application servers and app components that are generating errors. Monitoring for Java, .NET, Ruby, PHP, AWS, Azure and mobile platforms.
- Network Monitoring: Comprehensive monitoring for critical network devices such as routers, switches and firewalls. Assist network teams get deep performance visibility required to manage complex networks.
- Public and Private Cloud Monitoring: Get complete visibility across your cloud resources. Monitor workloads and troubleshoot app performance on cloud and virtualization platforms like Amazon Web Services, Azure and VMware.
Monitoring Availability and End User Experience Made Simple.