The latest News and Information on Monitoring for Websites, Applications, APIs, Infrastructure, and other technologies.
Earlier this year, we introduced the Grafana Cloud Agent, a subset of Prometheus built for hosted metrics that runs lean on memory and uses the same service discovery, relabeling, WAL, and remote_write code found in Prometheus. Thanks to trimming down to the parts only needed for interaction with Cortex, tests of our first release have seen up to a 40% memory-usage reduction compared to an equivalent Prometheus process.
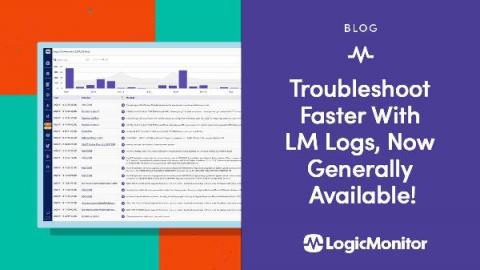
This past year we’ve been hard at work building LM Logs to help ITOps and DevOps teams troubleshoot more efficiently. Today we are happy to announce that LM Logs is generally available! LM Logs is an intelligent log monitoring solution that analyzes 100% of log data and surfaces it contextually with metrics and alerts for faster troubleshooting.
Gartner Peer Insights evaluates peer review and ratings for software and service providers. The reviews offer valuable insights for decision-makers and plays a key role in the IT buying process. Catchpoint was picked as a Gartner Peer Insights 2020 Customers’ Choice in the Network Performance Monitoring & Diagnostics (NPMD) category. Network performance monitoring and diagnostic (NPMD) tools aid in understanding network health, performance, and how it behaves in different scenarios.
The concept of a microservice perfectly fits the structure of a serverless function, which easily enables deployment and runtime isolation for different services. On the storage side, services such as DynamoDB also make it easier to have independent databases for each microservice and scale them independently (when required or desirable). Before we dive into details, please consider whether the benefits of Microservices abundantly outweigh its disadvantages for your particular project and team.
This short guide for conducting successful big data analysis will take you through a couple of the most essential tips to help you learn how to analyse data & become a better data analyst by avoiding rookie mistakes and embracing the correct mindset to get the most from your data. We’ll also cover some of ways that conducting effective data analysis can help your organisation.
With an ever growing list of infrastructure improvements, new features, and issues to debug, setting up your observability tools to keep up with best practices can fall down your list of priorities. There’s simply not enough time to set up new dashboards that can give you the visibility you need to be proactive with your infrastructure.
It’s budgeting season for many of us. As a result, capacity planning and cost justification for hardware purchases are likely on your mind. But don’t fear, because Galileo has you covered. We’ve curated a bunch of our most popular and helpful resources for your capacity planning project, and they’re all here in one handy place.