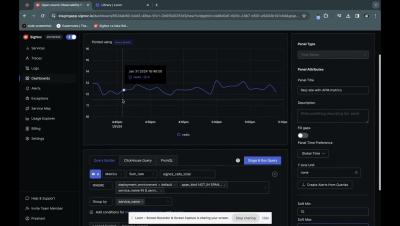
Operations | Monitoring | ITSM | DevOps | Cloud

Optimizing APM Costs and Visibility with Cribl Stream and Search

OpenTelemetry is starting to gain critical mass due to its vendor neutrality and having worked in the APM space for the last five years. I can see the appeal. Using OpenTelemetry libraries to instrument your code frees you from putting vendor libraries in your codebase. The other challenge most customers face is balancing cost versus visibility. While effective, most APM solutions are costly.

RabbitMQ monitoring with OpenTelemetry

More about SigNoz: SigNoz - Monitor your applications and troubleshoot problems in your deployed applications, an open-source alternative to DataDog, New Relic, etc. Backed by Y Combinator. SigNoz helps developers monitor applications and troubleshoot problems in their deployed applications. SigNoz uses distributed tracing to gain visibility into your software stack. If you need any clarification or find something missing, feel free to raise a GitHub issue with the label documentation or reach out to us at the community slack channel.

Troubleshoot streaming data pipelines directly from APM with Datadog Data Streams Monitoring

When monitoring applications with streaming data pipelines, there are additional complexities to consider that are not present in traditional batch-processing systems. Whether you’re using streaming data pipelines to power a digital trading platform, capture sensor data from an IoT device, or recommend news articles to users, it can be challenging to identify the root cause of delays when you’re dealing with distributed systems, real-time data, and the dynamic nature of events.

Understanding Flame Graphs for Visualizing Distributed Tracing

In the ever-evolving world of software development, one constant remains - the pursuit of better performance. As applications grow in complexity and demand, the need for tools to uncover performance bottlenecks becomes paramount. Flamegraphs, a brainchild of Brendan Gregg, has emerged as an important visualization of insight, showing those dark corners of your codebase that need optimization.

Database Trends 2024: The Power of Cloud, Consumption Models, and the Popularity of PostgreSQL

A large proportion of our customers rely on eG Enterprise to monitor and troubleshoot application and end-user experience problems caused by problems in underlying database dependencies. Our end-to-end unified monitoring and root-cause analysis platform supports all major database technologies. Over recent years, we have witnessed a significant shift from traditional on-premises databases to more dynamic, scalable solutions.

Loki vs Elasticsearch - Which tool to choose for Log Analytics?

Elasticsearch, or the ELK stack, is a popular log analytics solution. The Loki project was started at Grafana Labs in 2018. Grafana leads the development of Loki, while Elastic is the company behind Elasticsearch. In this article, we will do a detailed comparison between these two tools for log analytics. Log data helps application owners debug their applications while also playing a critical role in cyber security.

OTel Applications on Retrace

We are excited to inform you that Open Telemetry is now available for you with the introduction of “Netreo OTel Appliance”. With the OTel Appliance, cloud-native services like AWS Lambda, AWS ECS, AWS EKS, Azure Functions, Azure App Services, Azure Container Instances, and Azure Kubernetes Services can be monitored and you see application traces and logs in Retrace UI (s1.stackify.com). The applications hosted in the cloud Serverless and containers can be monitored without running the Retrace agent within the instance itself.

We've done it again: ManageEngine named a 2023 Gartner Peer Insights Customers' Choice for Application Performance Monitoring and Observability!

At ManageEngine, customers are at the heart of everything we do. That’s why we are excited to be recognized as a 2023 Gartner Peer Insights™ Customers’ Choice for Application Performance Monitoring and Observability. This year marks the fifth time we have been recognized with this distinction.

Decoding PostgreSQL Monitoring | 101 Guide

Monitoring PostgreSQL for performance issues is critical. PostgreSQL is a powerful open-source relational database system that stands out for its robustness, scalability, and strong emphasis on extensibility and standards compliance. In this guide on PostgreSQL monitoring, we will cover key PostgreSQL metrics that should be monitored, best practices for monitoring PostgreSQL and some tools with which you can set up PostgreSQL monitoring.

How to Monitor PostgreSQL metrics with OpenTelemetry

PostgreSQL metrics monitoring is important to ensure that PostgreSQL is performing as expected and to identify and resolve problems quickly. In this tutorial, you will install OpenTelemetry Collector to collect PostgreSQL metrics and then send the collected data to SigNoz for monitoring and visualization. In this tutorial, we cover: If you want to jump straight into implementation, start with this prerequisites section.

Datadog on Design Systems

Over the last five years, the Datadog platform has grown. We added Application Performance Monitoring to complement our core infrastructure monitoring product, Log Management, Synthetic and Real User Monitoring, and more. For an enterprise software platform to be successful, the whole has to be greater than the sum of its parts. In Datadog’s case, this means users must be able to connect different types of data, pivot seamlessly from one context to another, and follow the thread of an investigation wherever it might lead.

How to easily add application monitoring in Kubernetes pods

The Elastic APM K8s Attacher lets the Elastic APM agent auto-attach to the application in your pods by adding just one annotation to your deployment The Elastic® APM K8s Attacher allows auto-installation of Elastic APM application agents (e.g., the Elastic APM Java agent) into applications running in your Kubernetes clusters. The mechanism uses a mutating webhook, which is a standard Kubernetes component, but you don’t need to know all the details to use the Attacher.

Docker Log Rotation Configuration Guide | SigNoz

It is essential to configure log rotation for Docker containers. Log rotation is not performed by default, and if it’s not configured, logs on the Docker host can build up and eat up disk space. This guide will teach us how to set up Docker log rotation. Logs are an essential piece of telemetry data. Logs can be used to debug performance issues in applications.

What are Cloudwatch Metrics? How to implement Custom Metrics in Cloudwatch?

CloudWatch metrics play a critical role in monitoring AWS resources and facilitating effective troubleshooting during system failures. It allows for continuous monitoring of AWS resources like EC2 instances, Lambda functions, and RDS databases. Using Cloudwatch metrics, DevOps teams can monitor and manage their AWS infrastructure easily. Amazon CloudWatch is a comprehensive monitoring and observability service provided by Amazon Web Services (AWS).

Transform Your Customer Experience with DevOps Collaboration

Learn how end-to-end monitoring and observability enable enterprises to break down team silos and deliver industry-leading experiences for their customers and achieve business benefits such as: Improved business resilience by identifying and resolving IT risks faster before they result in customer service outages Increased competitive standing with DevOps and shift-left best practices to accelerate software releases.

Scaling Down Kubernetes Clusters

Datadog, the observability platform used by thousands of companies, runs on dozens of self-managed Kubernetes clusters in a multi-cloud environment, adding up to tens of thousands of nodes, or hundreds of thousands of pods. This infrastructure is used by a wide variety of engineering teams at Datadog, with different feature and capacity needs.

What is Cloudwatch Metrics? Detailed 101 Guide

CloudWatch metrics play a critical role in monitoring AWS resources and facilitating effective troubleshooting during system failures. It allows for continuous monitoring of AWS resources like EC2 instances, Lambda functions, and RDS databases. Using Cloudwatch metrics, DevOps teams can monitor and manage their AWS infrastructure easily. Amazon CloudWatch is a comprehensive monitoring and observability service provided by Amazon Web Services (AWS).

Monitoring Docker Containers Using OpenTelemetry [Full Tutorial]

Monitoring Docker container metrics is essential for understanding the performance and health of your containers. OpenTelemetry collector can collect Docker container metrics and send it to a backend of your choice. In this tutorial, you will install an OpenTelemetry Collector to collect Docker container metrics and send it to SigNoz, an OpenTelemetry-native APM for monitoring and visualization.

Monitoring CouchDB with OpenTelemetry and SigNoz

OpenTelemetry can help you monitor CouchDB performance metrics with the help of OpenTelemetry Collector. In this tutorial, you will install OpenTelemetry Collector to collect CouchDB metrics and then send the collected data to SigNoz for monitoring and visualization. Before that, let’s have a brief overview of CouchDB. If you want to jump straight into implementation, start with this Prerequisites section.

Provisioning and Autoscaling

Datadog, the observability platform used by thousands of companies, runs on dozens of self-managed Kubernetes clusters in a multi-cloud environment, adding up to tens of thousands of nodes, or hundreds of thousands of pods. This infrastructure is used by a wide variety of engineering teams at Datadog, with different feature and capacity needs.

JS Toolbox 2024: Essential picks for modern developers (Overview)

Staying ahead of the curve in JavaScript development requires keeping on top of the ever-evolving landscape of tools and technologies. As we head into 2024, the sprawling world of JavaScript development tools will continue to transform, offering more refined, efficient, and user-friendly options. This ‘JS Toolbox 2024’ series is your one-stop for a comprehensive overview of the latest and most impactful tools in the JavaScript ecosystem.

101 Guide to RabbitMQ Metrics Monitoring

This guide covers key metrics important for efficiently monitoring RabbitMQ. We will also talk about in-built RabbitMQ monitoring tools with which you can start monitoring your RabbitMQ instances. In fast-paced, data-driven applications where our data flows between the systems at lightning speed - the reliability and efficiency of your messaging infrastructure can make or break your whole application.

Observability vs. APM: What to Know on Your Monitoring Journey

In the ever-evolving landscape of software development and IT operations, monitoring tools play a pivotal role in ensuring the performance, reliability, and availability of your applications. Two key disciplines in this domain are observability and Application Performance Management (APM). This post will help you understand the nuances between observability and APM, exploring their unique characteristics, similarities, benefits and differences.

Sponsored Post

Improving API error responses with the Result pattern

In the expanding world of APIs, meaningful error responses can be just as important as well-structured success responses. In this post, I'll take you through some of the different options for creating responses that I've encountered during my time working at Raygun. We'll go over the pros and cons of some common options, and end with what I consider to be one of the best choices when it comes to API design, the Result Pattern. This pattern can lead to an API that will cleanly handle error states and easily allow for consistent future endpoint development.

Log Monitoring 101 Detailed Guide [Included 10 Tips]

Log monitoring is the practice of tracking and analyzing logs generated by software applications, systems, and infrastructure components. These logs are records of events, actions, and errors that occur within a system. Log monitoring helps ensure the health, performance, and security of applications and infrastructure. Log Monitoring helps in early detection of potential issues, ensuring systems run smoothly and efficiently. In this detailed 101 guide on Log monitoring, we will learn.

OpenTelemetry in 2023 - What we learnt from the community and our users

OpenTelemetry has brought a sea change in the world of observability. The idea of the project was to standardize the instrumentation needed for generating telemetry. Teams shouldn’t need to change how they collect data if they want to try a new visualization/backend for the telemetry data. That was the vision. This idea seems to have resonated with the developer and devops communities.

Paving the Road for Proactive Reliability

At Expedia Group, Kaushik Patel and Nikos Katirtzis have thousands of engineers and micro-services. Heterogeneity in terms of infrastructure and technologies used over the years created inefficiencies and posed the need for a set of automated best practices for our engineering teams. Over the past 2 years, using a data-driven approach, we’ve worked on creating a set of platforms that helps teams to adopt good reliability practices, including chaos engineering, release safety, or automatic failover between cloud regions. In this talk Kaushik and Nikos will cover the platforms they’ve built, including how they used data to drive their investment decisions.

The Importance of Traces for Modern APM [Part 2]

In part 1, we looked at how the design plan of traditional monitoring technologies depended heavily on properties of the systems that were intended to monitor and then showed how those properties began to be undermined by an increase in complexity, an increase which can ultimately be captured by the concept of entropy. In this part, we will explore how increased entropy forces us to rethink what is required for monitoring.

LLM Observability with OpenTelemetry and SigNoz

In the rapidly evolving world of Large Language Models (LLMs), ensuring peak performance and reliability is more critical than ever. This is where the concept of 'LLM Observability' comes into play. It's not just about monitoring outputs; it's about gaining deep insights into the internal workings of these complex systems.

Improved Dashboard Performance, Better Trace View UX & New Logs Processors - SigNal 32

Welcome to the last SigNal of 2023! 12 months of building and shipping things to make open-source observability available to teams of all sizes. What a great journey it has been for Team SigNoz in the year 2023. We crossed some great milestones - raised $6.5MN to supercharge our growth, more than 15,000 Github stars, and 8.6 million Docker downloads. And the best part of our journey has been building with our community.

How to export Azure Monitor Metrics using OpenTelemetry to SigNoz

Using OpenTelemetry Collector, you can collect metrics from Azure monitor and export them to any backend of your choice. Azure Monitor is a powerful service within the Microsoft Azure ecosystem that provides extensive metrics and logging capabilities. Yet the siloed nature of data in such tools can obscure the bigger picture, hindering a holistic view of system health. In this tutorial, we cover: If you want to jump straight into implementation, start with this Prerequisites section.