logz.io

Boston, MA, USA
2014
  |  By Adam Cazes
Despite advances in the world of observability, log management hasn’t evolved much in recent years. Users are familiar with the experience of Kibana or OpenSearch Dashboards (OSD), but those don’t always meet modern use cases. Logz.io is ready to change the conversation with the introduction of Explore, the new path forward for Log Management for users of the Logz.io Open 360™ observability platform.
  |  By Israel Efrati
In the dynamic world of container orchestration, Kubernetes stands out as the undisputed champion, empowering organizations to scale and deploy applications seamlessly. Yet, as the deployment scope increases, so do the associated Kubernetes workload costs, and the need for effective resource capacity planning becomes more critical than ever. When dealing with containers and Kubernetes you can find yourself facing multiple challenges that can affect your cluster stability and your business performance.
  |  By Jake O'Donnell
Every software-driven business strives for optimum performance and user experience. Observability—which allows engineering and IT Ops teams to understand the internal state of their cloud applications and infrastructure based on available telemetry data —has emerged as a crucial practice to help engage this process. For years, application performance monitoring (APM) was the de facto practice and tooling that organizations have used to keep tabs on their critical systems.
  |  By Jake O'Donnell
Data volumes are soaring. Environments are increasingly intricate. The risk of applications and systems encountering breakdowns is sky-high, and the mean time to recovery (MTTR) for production incidents is moving in the wrong direction. Disruptions not only jeopardize critical infrastructure but also have a direct impact on the bottom line of organizations. Swift recovery of affected services becomes paramount, as it directly correlates with business continuity and resilience.
  |  By Dotan Horovits
The topic of continuous profiling has been an ongoing discussion in the observability world for some time. I said back in 2021 that profiling was set to be the next major telemetry signal in observability, and in fact, since then there’s been growing interest in profiles. Startups and large observability vendors have gotten into this domain. A significant recent step was when the OpenTelemetry project decided to add profiles to its core signals and formalized the open unified specification for that.
  |  By Shawn Pitts
Kubernetes has changed the way many organizations approach the deployment of their applications. But despite its benefits, the additional layers of abstraction and reams of data can cause complexity around Kubernetes monitoring. We’ve seen so much of these challenges borne out in the results of the 2024 Observability Pulse survey. In the survey report, 36% of respondents say Kubernetes poses a challenge, and just 10% of organizations say they have full observability into their environments.
  |  By Asaf Yigal
The more data you have, the harder it becomes to read through it, let alone identify trends or crucial patterns. Couple that with a shortage of time, and the ability not only to visualize but also to communicate with your data becomes paramount.
  |  By Jake O'Donnell
Organizations like yours are increasingly reliant on complex IT infrastructures to support their operations. Pervasive use of Kubernetes and microservices architectures continues to up the ante. Amidst this complexity, achieving comprehensive visibility into systems and applications has become both imperative for ensuring performance, reliability, and security, while also becoming ever-more challenging to achieve.
  |  By Dotan Horovits
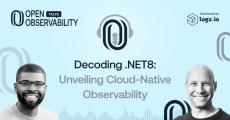
The.NET programming language is taking cloud native deployment and observability seriously, and most notably with the recent announcement of.NET Aspire stack unveiled at the recent.NET Conf 2023. In the latest episode of OpenObservability Talks, we reviewed the journey to making.NET a “by default, out of the box observable platform,” as ASP.NET Core creator David Fowler put it.
  |  By Matt Hines
There’s no debate — in our increasingly AI-driven, lean and data-heavy world, automating key tasks to increase effectiveness and efficiency is the ultimate name of the game. No matter what job you hold today, you’re likely being pushed to not only do more with less, but also perform your work with a tighter focus on specific outcomes and SLOs.
  |  By logz.io
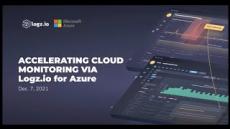
Watch this Logz.io and the Azure Cloud team webinar to learn about the Logz.io Azure Marketplace native integration. More specifically, about: Collecting logs from Azure resources or applications in minutes with Logz.io — all within the Azure Portal. Integrate Logz.io with Active Directory SSO for access control. Collect their logs through a new “pay for what you use” pricing model — rather than committing to log volumes and plans upfront.
  |  By logz.io
Azure users can now deploy the Logz.io platform directly from the Azure Console with the click of a button. The seamless integration between Azure and Logz.io delivers visibility and monitoring for enterprise organizations developing applications on Azure, providing the specific information needed to streamline code development and achieve business agility.
  |  By logz.io
Logz.io recently announced General Availability for Prometheus-as-a-service. In this webinar, we’ll help Prometheus users understand the advantages of offloading Prometheus metrics storage to Logz.io, as well as unifying metrics alongside logs and traces.
  |  By logz.io
Logz.io Infrastructure Monitoring delivers Prometheus-as-a-service, which centralizes your Prometheus metrics on Logz.io’s scalable cloud platform for storage and analysis and unifies your metrics with logs and traces.
  |  By logz.io
The latest cloud security news from top security professionals.
  |  By logz.io
Logz.io Log Management automatically centralizes, parses, and indexed your log data on Logz.io's high-powered ELK Stack.

Logz.io is an AI-powered log analysis platform that offers the open source ELK Stack as a enterprise-grade cloud service with machine learning technology. Our platform uses AI and and machine-learning algorithms to help DevOps engineers, system administrators, and developers to find critical events in the volumes of information that are now constantly generated in IT environments.

Created by a Check Point veteran and a former algorithm engineer for the Israeli military, the enterprise-grade, cloud platform is built on top of the ELK Stack and provides real-time access to data insights based on the collaborative knowledge of IT executives throughout the world. The ELK Stack -- Elasticsearch, Logstash, and Kibana -- is the world’s most popular open-source log analytics software stack.