The latest News and Information on Monitoring for Websites, Applications, APIs, Infrastructure, and other technologies.
This article was written by InfluxDB Community member and InfluxAce David McKay. Eighteen hours ago, I was meeting with some colleagues to discuss our Kubernetes initiatives and grand plan for improving the integrations and support for InfluxDB running on Kubernetes. During this meeting, I laid out what I felt was missing for InfluxDB to really shine on Kubernetes.
For years, Splunk has provided the ability to display dismissible Bulletin Messages. But what if you need to show a non-dismissible, highly-visible message across all your product pages? Now you can, with the new Global Banner! One of our top-voted Customer Ideas, the Global Banner allows an admin to display a one-line message, with optional hyperlink, at the top of their product pages.
Today, more than ever, mobilizing remote teams to triage and resolve outages separates is separating enterprises able to accelerate their digital initiatives from those who don’t. Observability has elevated our ability to quickly detect problems and ask questions in our system to triage and reduce “time to clue” — an increasingly important metric.
Serverless architectures remove the need to provision and maintain infrastructure components like servers and containers, so developers can focus on writing and deploying code. However, serverless architectures also introduce new challenges to monitoring and observability. Teams building serverless applications can iterate quickly and deploy frequent code and configuration changes, making it difficult to track what impact these changes have on your applications.
Maintaining call quality with Microsoft Teams is a process, not a one time event. Network engineers and Microsoft Teams application owners need to be vigilant in preserving optimal call quality to ensure audio, video, and screen-sharing always remain satisfactory for end-users. And vigilance is just as important before the pandemic as it is during the pandemic no matter where your users are working from. In some ways its more important today when working from home.
ObservabilityCON 2020 is live! Over the next few days, Grafana Labs is bringing together the Grafana community for talks dedicated to observability. Day 1 was filled with several new announcements about exciting projects and feature enhancements we’ve been working on for our customers and community. And there will be a lot more to learn about this week, like the session on Loki 2.0 on Wednesday.
Grafana Labs is proud to announce an easy-to-operate, high-scale, and cost-effective distributed tracing system: Tempo. Tempo is designed to be a robust trace id lookup store whose only dependency is object storage (GCS/S3). Join us in the Grafana Slack #tempo channel or the tempo-users google group to get involved today!
Setting up triggers within AppSignal is a powerful way to discover that the bits started hitting the fan. You can use triggers to get an alert if an error rate is higher than 1%, your server runs out of memory, or even if your hourly login drops to zero. Our latest update makes the creation of triggers much easier.
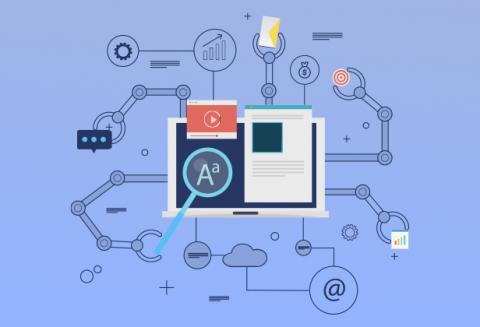
Automation has evolved from being a management consultant’s go-to-advice to being a central part of every organization’s strategic plan. The biggest misconception about automation is that it is exercised in areas where the company wants to reduce human capital. Contradictorily, automation standardizes mundane processes and frees employees to focus on more value-producing activities that require their unique skills and knowledge.