Uptrends becomes part of the ITRS Group
We have some important news to report: Uptrends becomes part of the ITRS Group in a transaction to acquire 100% of the company.


The latest News and Information on Monitoring for Websites, Applications, APIs, Infrastructure, and other technologies.
We have some important news to report: Uptrends becomes part of the ITRS Group in a transaction to acquire 100% of the company.
The biggest shopping days of the year, Black Friday and Cyber Monday, are nearly upon us—again. If you’re on the development, operations, DevOps, or marketing team of a large e-commerce website, your busiest season is coming fast. Thanksgiving signals the start of long days, big sales, massive website traffic, and plenty of unexpected threats to your website’s uptime and performance.
Exciting news! We have recently updated our Webhooks integration to allow custom headers in order to integrate with third party alarming tools. This update makes our webhooks integration more powerful and adaptable. The Webhook integration allows you to get RapidSpike notifications in your applications, and custom headers lets us send extra data along with the Webhook, which some third parties may require.
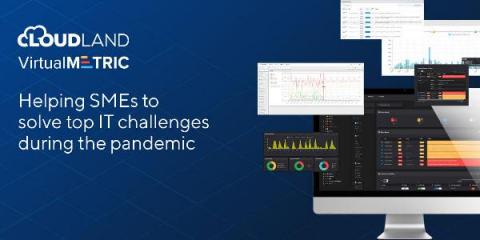
VirtualMetric — the all-in-one monitoring solution provider and CloudLand — one of the leading IT distributors in the Netherlands, join efforts to help SMEs from the DACH region and the Netherlands to overcome the top IT challenges during the pandemic. Although the IT sector is one of the most stable during the global pandemic crisis, small and medium enterprises need to battle their specific problems – internal and external.
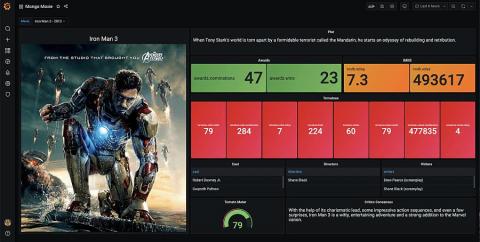
MongoDB is one of the most popular NoSQL databases in the world, used by millions of developers to store application metrics from e-commerce transactions to hospital equipment inventory, from user logins to First World War diaries. MongoDB databases contain mountains of information that SREs, software engineers, and executives can visualize to run their businesses more effectively. Grafana dashboards are most effective when they are layered with context.
In a previous blog we learnt about setting up a Scalable Prometheus-Thanos monitoring stack. We also learnt about how we can cluster multiple Prometheus servers with the help of Thanos and then deduplicate metrics and alerts across them. MetricFire is a Hosted Prometheus solution, and you can use our product with minimal configuration to gain in-depth insight into your environments. If you would like to learn more about it please book a demo with us, or sign up for the free trial today.
We all know that SCOM is a monitoring powerhouse, but even the biggest SCOM fan can’t deny that the SCOM Console dashboards leave much to be desired. They might look colorful, but unfortunately there’s not much else they can do. You can’t drill down further into an object, and you definitely can’t correlate it with other data you might have on that object that could be related.