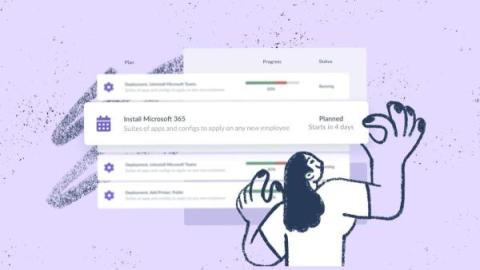
We’re excited to share an update on our Microsoft Azure integration that automates discovery and mapping of key cloud assets into Tidal Accelerator. Tidal has enabled a new integration that pulls information on Azure Virtual Machines (VMs), Azure App Service, and Azure Database instances, Elastic Pools and Servers, directly into Tidal Accelerator for further analysis.
In today’s world, resilience is no longer a conditioned desire or methodology to try but has become a necessity for sustained success in software development and IT operations. As DevOps and Agile teams keep moving forward to cross boundaries, come up with new methodologies, and drive innovation, it is now important to have the ability to quickly recover from failures, adapt to changing conditions, and maintain high performance under pressure.
Graphite and Prometheus are both great tools for monitoring networks, servers, other infrastructure, and applications. Both Graphite and Prometheus are what we call time-series monitoring systems, meaning they both focus on monitoring metrics that record data points over time. At MetricFire we offer a hosted version of Graphite, so our users can try it out on our free trial and see which works better in their case.
Behind the trends of cloud-native architectures and microservices lies a technical complexity, a paradigm shift, and a rugged learning curve. This complexity manifests itself in the design, deployment, and security, as well as everything that concerns the monitoring and observability of applications running in distributed systems like Kubernetes. Fortunately, there are tools to help developers overcome these obstacles.
Sometimes innovation requires ideas unconstrained by traditional structures and removed from day-to-day responsibilities. It was in this spirit that PagerDuty’s People HackWeek–a friendly competition to explore how generative AI might impact the future of HR–was born.