Operations | Monitoring | ITSM | DevOps | Cloud

The latest News and Information on Monitoring for Websites, Applications, APIs, Infrastructure, and other technologies.

Aggregating Hosted DigitalOcean Logs to Papertrail

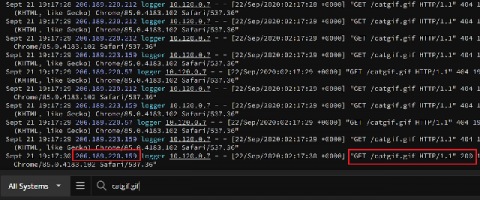
DigitalOcean droplets provide low-cost scale from a popular server provider. With DigitalOcean Monitoring, you can collect metrics for visibility, monitor Droplet performance, and receive alerts when problems arise in your infrastructure. But when you need to deep dive into your application to debug an issue, resolve an incident, or identify opportunities to improve your platform, you need a deep understanding of the underlying operating system and how it interacts within its environment.

Why Predict When You Can Prevent?

In the evolving world of IT monitoring, I see that many organizations want to move to predictive monitoring. They usually allocate a significant budget for this type of effort that ultimately fails to yield the desired return on investment. Often, organizations are already collecting and processing large amounts of IT telemetry streams and using multiple solutions to monitor their systems. So, predictive monitoring seems like the logical next step.

Milestone Met - 100k IPv6 Subnets Announced!

It took about twenty-three years, a couple of IPv6 days, the exhaustion of most of the IPv4 address pools available at Regional Internet Registries (RIRs), and the increase of prices in IPv4 address market, but finally, it looks like IPv6 made it and met one important threshold in November 2020 – 100k IPv6 prefixes are now currently announced on the Internet!

AWS Well-Architected and Serverless: Performance Efficiency

And just like that – welcome to the last part in our “Well-Architected and Serverless” series. We hope it’s been informative, insightful, and fun for you, to explore the five pillars of the AWS Well-Architected Framework (WAF) with us! Read the previous posts: Part 1: Security Pillar Part 2: Operational Excellence Pillar Part 3: Reliability Pillar Part 4: Cost Optimization Pillar So let’s look into the last – Performance Efficiency (PERF) – pillar.

Application Performance Management for Microservices with Sumo Logic

Distributed tracing allows you to track the execution of your user's transactions by following them between applications’ microservices. It provides easy to understand visualizations of transactional lifespan with the ability to pinpoint any slowdowns and errors in response to microservices. During my presentation at Illuminate, I shared that we extended the Sumo Logic platform to cover application performance use cases.

Top 12 Advantages of Effective IT Monitoring Software

As a company’s IT systems develop and overlap in function, it becomes increasingly important that they be carefully monitored at all times. Active network monitoring helps to ensure central servers and systems are functioning as intended, while also allowing business management staff to keep an eye on employee activity in the process.

5 effective IP tools for network discovery and troubleshooting

Inspecting complicated network issues shouldn’t require you to switch between multiple tabs and network records. Solving these issues often boils down to finding the IP addresses of a network entity. Be it a desktop, server, port, or some other entity, its IP address gives you much-needed insight into details like its asset tag, interface specifics, user, and device type. This information helps you get to the bottom of network issues, aiding in effective troubleshooting.

Automate vulnerability analysis with the Datadog GitHub Action

To enhance and automate your vulnerability analysis, we’re excited to launch the Datadog Vulnerability Analysis GitHub Action. The action enables easy integration between your application, Datadog Continuous Profiler, and Snyk’s vulnerability database to provide actionable security heuristics. The action can be installed directly from the GitHub Marketplace, and does not require you to manage any additional scripts or infrastructure.