Getting started with EventSentry v4.2.x
This video helps new users get started with EventSentry quickly by walking them through the most important areas of the management console and web reports.


The latest News and Information on Monitoring for Websites, Applications, APIs, Infrastructure, and other technologies.
This article is part 2 of a four-part series of articles about Elasticsearch performance monitoring. Part 1 explains what Elasticsearch is and how it works, while in this part, we’re going to look at Elasticsearch’s capabilities and potential use cases, and how to check its status. We’ll identify key metrics that you need to monitor to maintain the health and performance of your Elasticsearch cluster.
Breaking down larger, monolithic software, services, and applications into microservices has become a standard practice for developers. While this solves many issues, it also creates new ones. Architectures composed of microservices create their own unique challenges. In this article, we are going to break down some of the most common. More specifically, we are going to assess how observability-based solutions can overcome many of these obstacles.
More and more employers are looking for people experienced in building and running Kubernetes-based systems, so it’s a great time to start learning how to take advantage of the new technology. Elasticsearch consists of multiple nodes working together, and Kubernetes can automate the process of creating these nodes and taking care of the infrastructure for us, so running ELK on Kubernetes can be a good options in many scenarios.
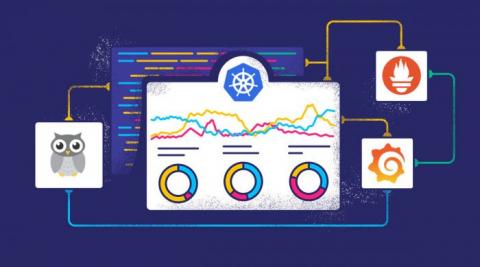
Kubernetes monitoring can be complex. To do it successfully requires several components to be monitored simultaneously. First, it’s important to understand what those components are, which metrics should be monitored and what tools are available to do so. In this post, we’ll take a close look at everything you need to know to get started with monitoring your Kubernetes-based system.