Operations | Monitoring | ITSM | DevOps | Cloud

The latest News and Information on Monitoring for Websites, Applications, APIs, Infrastructure, and other technologies.

The 7 cultural values that drive Grafana Labs

At Grafana Labs, we believe that our culture is one of the differentiators that make us an extraordinary company. In the middle of a pandemic, we’ve been in the very fortunate position to be in a high-growth phase: We’ve expanded the team by 118% this year, and our headcount just tipped over 250 global Grafanistas.
Create a New Integration in Opsgenie

Opsgenie is a powerful alert management service that allows you to flexibly set up teams for different alerting groups. Our development team have been working hard to deliver new features and integrations, and now you are able to integrate Opsgenie with RapidSpike to help with your website monitoring.

Top IT Infrastructure Monitoring Trends to Look Out For

IT Infrastructure Monitoring has evolved beyond imagination over the last decade and continues to, courtesy of new technology. It’s not focused on IT elements anymore, as Infrastructure & Operations (I&O) is becoming more business-centric. That also gives rise to challenges for IT leaders who need to adapt at a quick pace. It’s not news that infrastructure monitoring is extremely important for the health of any enterprise.

Pipeline Analytics for Code-To-Cloud Visibility

The software delivery chain (SDLC) is the application of applications. If it is not running, you cannot ship code. In this episode of Dissecting DevOps, Dave and Chris cover how you Operate, Measure, and Audit your SDLC to ensure that your organization has Code-To-Cloud Visibility. Because the SDLC is an app for apps, treat it as you would any other application.

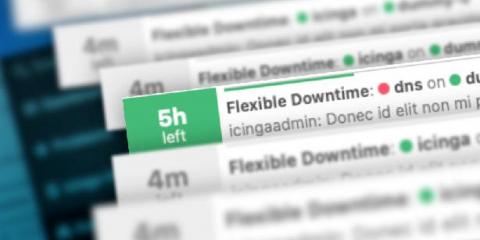
How downtimes are displayed in Icinga DB Web

With the development of Icinga DB we not only rebuilt the core of how Icinga stores and reads monitoring data. With a complete rebuild of the monitoring module we took the chance and refined most aspects of the user interface as well. One aspect that got attention is the display of downtimes, using their time based nature and putting the resulting data into context and visualizing it. Here are some of the details. Icinga DB Web Downtime List.

What are logs and why monitor them?

What are logs? In computing, when generally speaking of “log”, we refer to information belonging to a more or less low level reported by the operating system or a specific application that helps identify what is being done, including errors, problems or minor warnings, and when that happens, it indicates the date and time. In some cases, the source, the user, the IP address and other interesting fields from the point of view of what has happened can be identified.

6 quick ways to cut cost on your Lambdas

We’ve talked about how serverless architecture is a great option for companies that are looking to optimize costs. Just like with all app building and developments, monitoring the performance of your implementation is crucial and we, the folks at Dashbird, understand this need all too well – this is why we’ve spent the better part of the past year and a half to create a monitoring and observability solution for AWS Lambda and other Serverless services.

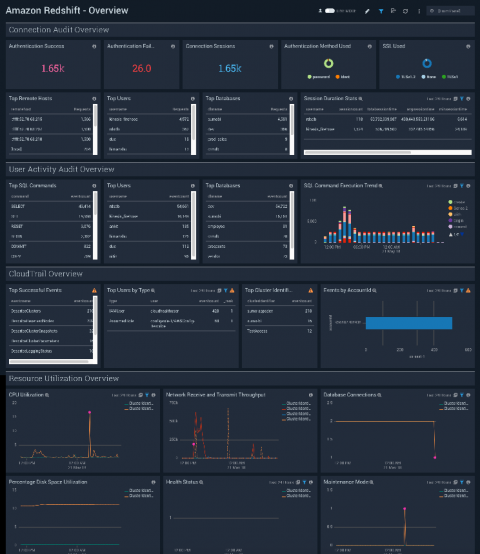
How to Monitor Amazon Redshift

Amazon Redshift is a cloud-based data warehousing solution that makes it easy to collect and analyze large quantities of data within the cloud. Cloud data warehouse services like Redshift can remove some of the performance and availability pain-points associated with on-premises data warehousing, but they are not a silver bullet. Getting the most out of Redshift requires carefully monitoring Redshift clusters in order to identify stability issues and performance bottlenecks.