The latest News and Information on Log Management, Log Analytics and related technologies.
Log files, which are the records of everything that has happened in your server, application, or framework, are generally unfiltered and huge. Going on for pages, these plain text files are packed with tons of information and are the initial go-to place for any troubleshooting. However, the challenge lies in reading, understanding, and interpreting log files, and ultimately pulling out the right piece of information required for analysis.
CIOs see data costs as their greatest logging challenge to overcome, according to this survey we collaborated on with IDC. If you’re running significant production operations, you’re almost certainly generating 100’s of GB of log data every day. Naturally, you’re also monitoring those logs and querying for incident investigations. However, most log data is never queried or analyzed, yet makes up the majority of logging costs.
Isn’t all logging pretty much the same? Logs appear by default, like magic, without any further intervention by teams other than simply starting a system… right?
In the field of open-source metrics and time series monitoring, it is quite clear today that Grafana is the most popular tool of choice. One of Grafana’s main advantages is its storage backend flexibility. It can support almost all the major time series datastores (Prometheus, InfluxDB, Elasticsearch, Graphite etc.), when each datastore has its own query language syntax, and slight differences in the actual Grafana UI and capabilities resulting from these differences.
When visiting a new website, it is quite normal to get carried away by the bells and whistles of the fancy UI and UX and not be able to appreciate all the lower level, back-end code that runs tirelessly to ensure a smooth and fast website experience. This is because your front-end HTML code has a visually rich browser page interface as a platform to showcase its output. Whereas your back-end, server-side code usually only has a console at its disposal.
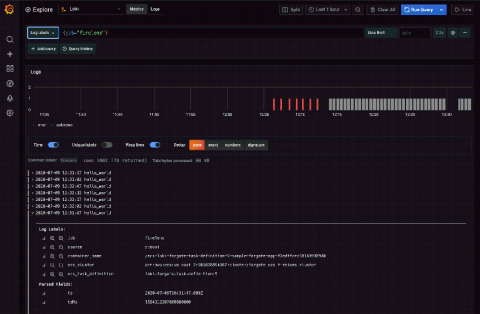
Elastic Container Service (ECS) is the fully managed container orchestration service by Amazon. Combined with Fargate, Amazon’s serverless compute engine for containers, you can run your container workload without the need to provision your own compute resources. But how can you consolidate and query all of your logs and metadata for these workloads? Enter Loki, the log aggregation system from Grafana Labs that has proven to increase performance and decrease costs.
Running a successful company relies on current and accurate information about the underlying systems. Much of this information is contained within your application logs. By investing in your log management solution, you can unlock these crucial insights and access a wealth of powerful data. This post presents a series of goals that will allow you to make the best possible use of your application logs.