Operations | Monitoring | ITSM | DevOps | Cloud

How to Monitor, Debug, and Update Infineon Devices with Memfault's IoT Reliability Platform

Developing secure, low-power feature-rich IoT products is a highly complex process for most developers. Memfault has partnered with Infineon to help developers working on Infineon ARM-based microprocessors alleviate this pain with Memfault’s IoT reliability platform. During the webinar, you learn how Infineon PSoC™ 6 developers can utilize Memfault's platform to understand how embedded devices are working, why they aren't working, and the impacts of device updates.

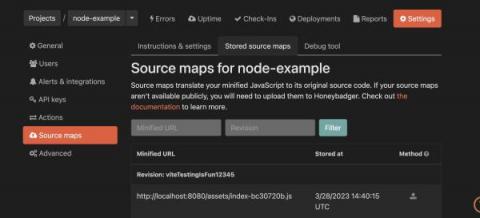
How to install the Site24x7 APM Insight Node.js agent

This video will walk you through the process of installing the Site24x7 APM Insight Node.js agent. The APM Insight Node.js agent automatically instruments supported frameworks (like Express, Koa, and Hapi) and records interesting events, like HTTP requests, database queries, errors, exceptions, web API calls, and remote calls. This installation method works in both Linux and Windows environments. Related notes and links.

How to verify the license key for a .NET application

Learn how to verify the license key when the.NET monitor fails to be created in the Site24x7 web client. About Site24x7 Site24x7 offers unified cloud monitoring for DevOps and ITOps. Monitor the experience of real users accessing websites and applications from desktop and mobile devices. Site24x7's in-depth monitoring capabilities enable DevOps teams to monitor and troubleshoot applications, servers, and network infrastructures (including private and public clouds). End-user experience monitoring is done from over 90 locations across the world and various wireless carriers.

Digging Into the Recent Azure Outage

In the early hours of Wednesday, January 25, Microsoft’s public cloud suffered a major outage that disrupted their cloud-based services and popular applications such as Sharepoint, Teams, and Office 365. Microsoft has since blamed the outage on a flawed router command which took down a significant portion of the cloud’s connectivity beginning at 07:09 UTC.

Grafana documentation: A look at the new and improved design

We recently launched a new design for our technical documentation. The goal of the redesign was to make our technical documentation more accessible, modern, and scalable as we grow. In addition to a new look (hello, new typeface and layout!), our updated docs pages reveal the underlying work our team has done to evolve and enhance our technical documentation.

Getting Out of the 1990s Era of Manual Troubleshooting

Because today’s businesses rely on their network like never before, the network needs to be available at all times to provide the connectivity required by remote workers, cloud applications, and automated systems. As the network has become critical to everyday operations, network troubleshooting has evolved from being a mundane task to one of the core functions of the Infrastructure & Operations (I&O) department.