The latest News and Information on Monitoring for Websites, Applications, APIs, Infrastructure, and other technologies.
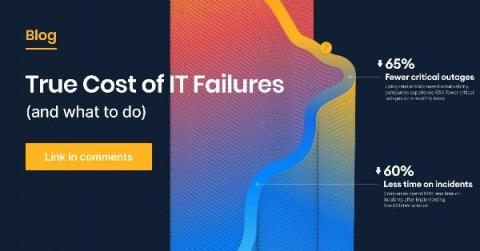
In this age of digital transformation, any issues with your IT infrastructure can cause major disruptions to your business. On top of this, IT environments that support critical business applications continue to get more complex and dynamic. As failures, outages, and incidents increase in volume and cost, the risk of an outage within your company becomes a very expensive one.
Honeycomb is all about collaboration: We believe that observability is a team sport, and we want to give you as many tools to help your team get the ball down the field (i.e., untangle knotty problems) as we can. We want you to be able to share the current state of your work so that others can follow and figure out what’s up, and we want you to leave breadcrumbs so the next time you’re stuck here, you can find your way back.
Welcome to part 2 of our blog series, where we go through how to forward container logs from Amazon ECS and Fargate to Splunk. In part 1, "Splunking AWS ECS Part 1: Setting Up AWS And Splunk," we focused on understanding what ECS and Fargate are, along with how to get AWS and Splunk ready for log routing to Splunk’s Data-to-Everything platform.
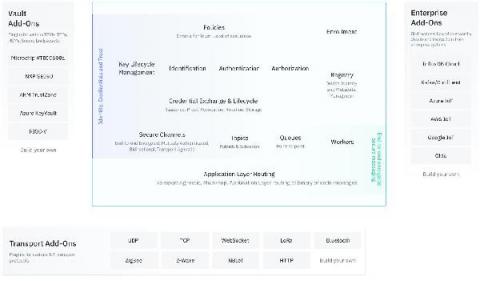
This article is a re-post of the article written by Matthew Gregory and published on the Ockam blog. Let’s investigate how to build applications with trusted time series data in a zero trust environment! To trust an application we need to trust the data that feeds into it. Increasingly, applications rely on time series data from outside the datacenter, at the edge, or in IoT. This means we need to think of trust and data in new ways.
We can plausibly say the enterprise development market turned the tide on cloud-native development in 2020, as most net-new software and serious overhaul projects started moving toward microservices architectures, with Kubernetes as the preferred platform.
In this article, we will discuss major features, differences, and similarities of the open-source monitoring tools known as Prometheus and Graphite. We will then dive into how you can benefit from MetricFire’s hosted Prometheus and Graphite. Lastly, we will explain why, given the choice, hosted Graphite could be a better monitoring option for you. MetricFire provides comprehensive monitoring solutions with Hosted Prometheus and Hosted Graphite.