Operations | Monitoring | ITSM | DevOps | Cloud

Trusted Data, Better AI Unifying Endpoint and Service Operations 1

AI outcomes are only as reliable as the operational data behind them. Fragmented asset data, siloed systems, and inconsistent context create a hidden trust gap — one that amplifies risk, undermines confidence in AI-driven decisions, and slows execution across endpoint, service, and security operations.
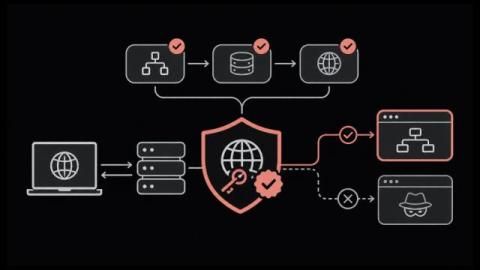
What Is DNSSEC? How DNS Security Extensions Stop Spoofing

Why would a domain with correct records, healthy name servers and a valid certificate stop resolving for part of the internet? Often it's DNSSEC. Your records are fine; the signatures behind them are not, and any resolver that checks signatures now refuses to answer. DNSSEC was designed to stop spoofing and cache poisoning, and it works. The catch is operational.

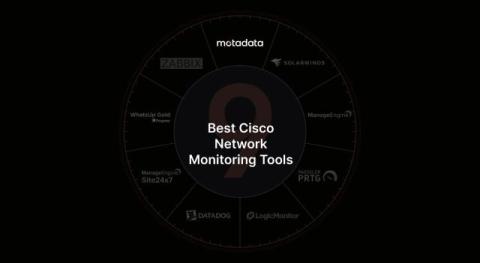
9 Best Cisco Network Monitoring Tools in 2026

Does your IT team have a clear view of your Cisco network's health and performance? Cisco routers, switches, firewalls, and wireless devices need regular monitoring to catch network issues before they affect users. Cisco network monitoring tools help you: However, not every tool supports Cisco technologies such as Meraki, IP SLA, ACI, and SD-WAN. In this guide, we compare 9 Cisco network monitoring tools based on their features, limitations, deployment options, and pricing.

Highlights from Oracle AI World 2026

Oracle AI World 2026 brought customers and partners to Las Vegas to explore how AI can support their existing business systems. At the event, Datadog participated in a session with Peloton Consulting Group and hosted a booth covering observability across Oracle Fusion Cloud Applications, Oracle Database, and Oracle Cloud Infrastructure (OCI).

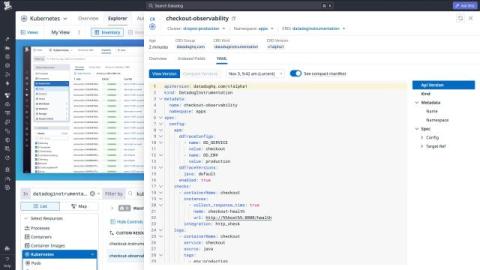
Manage Kubernetes observability with DatadogInstrumentation

For teams that own an application running on Kubernetes, updating its observability configuration should be as straightforward as updating any other Kubernetes resource. But configuring integration checks, log collection, and tracing often means working across multiple configuration paths. If those settings live in pod annotations, adding a metric check or changing log processing rules requires a Deployment rollout.

PagerDuty Microsoft Teams Integration: Setup and Limits

The PagerDuty Microsoft Teams integration gets incident notifications into Teams channels and lets responders acknowledge and resolve from there. It does not turn Teams into your on-call tool. It will not answer "who is on call for payments?" from a channel, it cannot post into private or shared channels, and it needs three different admins to set up. If your company runs on Teams, you should know exactly where that line falls before you design your incident process around it.

Survey: How Much Do Data Center Managers Trust Their Data? And Where Can They Improve?

Data center decisions are only as reliable as the information behind them. An asset inventory can accurately describe the equipment it records while still omitting assets that have not been documented. Power readings can be current for monitored equipment while other gaps go unnoticed. And when infrastructure data is spread across disconnected systems, getting a complete picture becomes harder.

GitHub's AI Coding Boom Exposes a Bigger Security Problem

GitHub's AI coding boom is exposing a major problem in software security. As AI coding agents generate more code and developers push commits faster than ever, can traditional DevSecOps and shift-left security practices keep up? In this episode of ShipTalk, cybersecurity leader Jake Bernardes breaks down GitHub Universe's AI coding trends and argues that shift-left security is dead in the age of AI-generated code.

Monitoring WooCommerce Background Jobs with AppSignal

WooCommerce relies on a lot of work happening in the background. Some of that is handled by WordPress cron, while other tasks are queued through Action Scheduler. This can include things like sending scheduled emails, processing subscription renewals, delivering webhooks, running scheduled WooCommerce actions, and other maintenance tasks that do not happen during a normal page request. The problem is that when one of these background jobs stops running, it is not always obvious straight away.

What's new with Grafana variables: less clutter, easier reuse across dashboards, and more

Template variables are one of the most used features in Grafana, providing users with a dropdown to turn one dashboard into hundreds: pick a different cluster, region, or service, and every panel updates. For most of Grafana's history, variables had a single home at the top of the dashboard. Each dashboard had one flat list of variables, and that list was shared by every panel on it. But as dashboards grew in size and number, those controls became harder to organize and maintain.